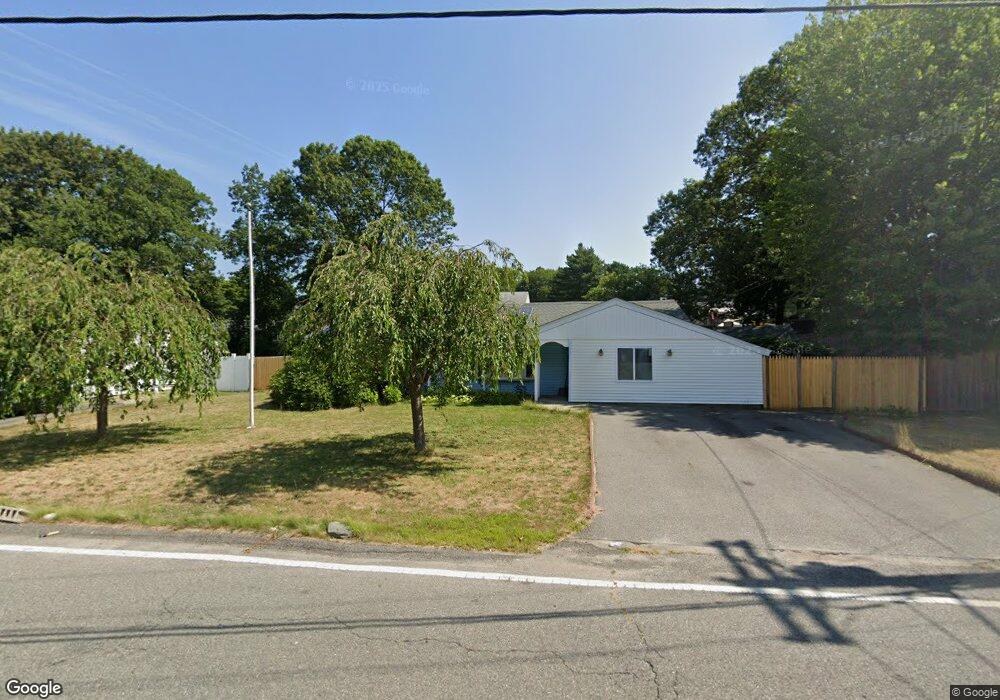
253 Sully Rd Brockton, MA 02302
Montello NeighborhoodEstimated Value: $467,886 - $535,000
4
Beds
1
Bath
1,376
Sq Ft
$361/Sq Ft
Est. Value
About This Home
This home is located at 253 Sully Rd, Brockton, MA 02302 and is currently estimated at $496,222, approximately $360 per square foot. 253 Sully Rd is a home located in Plymouth County with nearby schools including Brookfield Elementary School, Mary E. Baker Elementary School, and Downey Elementary School.
Ownership History
Date
Name
Owned For
Owner Type
Purchase Details
Closed on
Mar 10, 1994
Sold by
Ohara William J and Ohara Anne L
Bought by
Andrade Manuel J and Andrade Maria A
Current Estimated Value
Home Financials for this Owner
Home Financials are based on the most recent Mortgage that was taken out on this home.
Original Mortgage
$68,800
Interest Rate
7.7%
Create a Home Valuation Report for This Property
The Home Valuation Report is an in-depth analysis detailing your home's value as well as a comparison with similar homes in the area
Home Values in the Area
Average Home Value in this Area
Purchase History
| Date | Buyer | Sale Price | Title Company |
|---|---|---|---|
| Andrade Manuel J | $86,000 | -- |
Source: Public Records
Mortgage History
| Date | Status | Borrower | Loan Amount |
|---|---|---|---|
| Open | Andrade Manuel J | $100,000 | |
| Closed | Andrade Manuel J | $68,800 | |
| Closed | Andrade Manuel J | $88,800 | |
| Previous Owner | Andrade Manuel J | $90,000 |
Source: Public Records
Tax History
| Year | Tax Paid | Tax Assessment Tax Assessment Total Assessment is a certain percentage of the fair market value that is determined by local assessors to be the total taxable value of land and additions on the property. | Land | Improvement |
|---|---|---|---|---|
| 2025 | $5,150 | $425,300 | $158,300 | $267,000 |
| 2024 | $4,887 | $406,600 | $158,300 | $248,300 |
| 2023 | $4,476 | $344,800 | $108,500 | $236,300 |
| 2022 | $4,343 | $310,900 | $98,600 | $212,300 |
| 2021 | $4,072 | $280,800 | $91,000 | $189,800 |
| 2020 | $4,160 | $274,600 | $80,000 | $194,600 |
| 2019 | $3,754 | $241,600 | $76,200 | $165,400 |
| 2018 | $3,565 | $222,000 | $76,200 | $145,800 |
| 2017 | $3,151 | $195,700 | $76,200 | $119,500 |
| 2016 | $3,212 | $185,000 | $72,600 | $112,400 |
| 2015 | $2,815 | $155,100 | $72,600 | $82,500 |
| 2014 | $2,866 | $158,100 | $72,600 | $85,500 |
Source: Public Records
Map
Nearby Homes
- 170 Elsie Rd
- 244 Hovendon Ave
- 19 Rodwell St
- 275 Jon Dr
- 109 Lester Rd
- 30 Aspen St
- 133 Ardsley Cir
- 40 Christopher Rd
- 1004 S Franklin St
- 265 Winter St
- 717 Hampton Way
- 12 Hamilton Way
- 51 Oscar Ave
- 18 Banks St
- 81 Dixon Rd
- 89 Dixon Rd
- 719 S Franklin St Unit C Block 1
- 30 Intervale St
- 115 Ames St
- 14 Leonard Ln
Your Personal Tour Guide
Ask me questions while you tour the home.