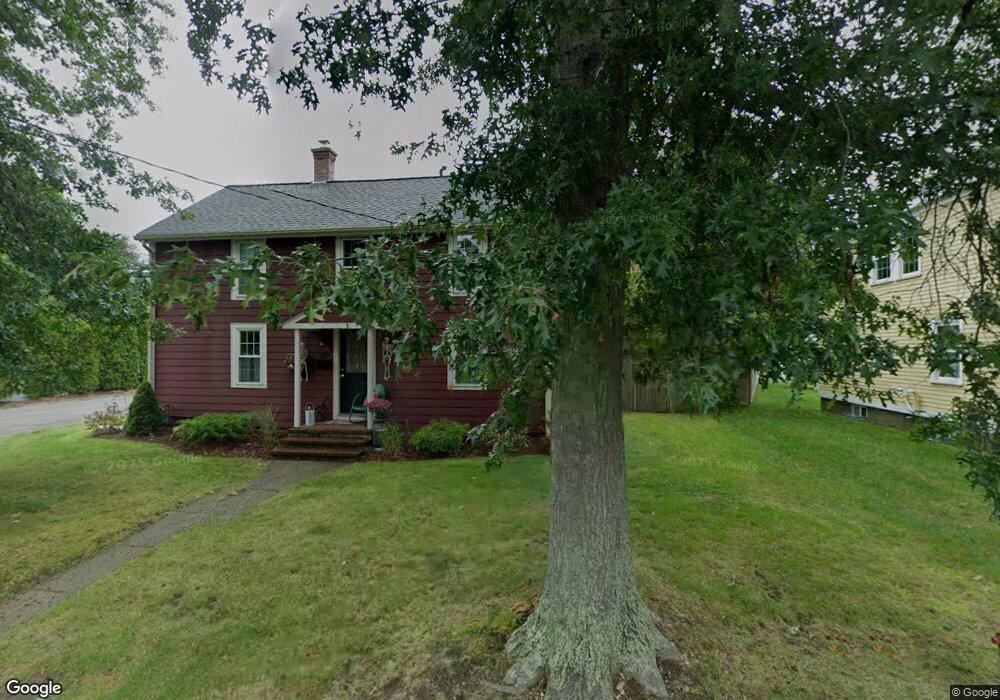
253 Union St Millis, MA 02054
Estimated Value: $650,566 - $675,000
3
Beds
2
Baths
1,782
Sq Ft
$370/Sq Ft
Est. Value
About This Home
This home is located at 253 Union St, Millis, MA 02054 and is currently estimated at $659,642, approximately $370 per square foot. 253 Union St is a home located in Norfolk County with nearby schools including Clyde F Brown, Millis Middle School, and Millis High School.
Ownership History
Date
Name
Owned For
Owner Type
Purchase Details
Closed on
Aug 17, 1992
Sold by
Clancy Christopher F
Bought by
Kelly Scott W and Kelly Karen M
Current Estimated Value
Home Financials for this Owner
Home Financials are based on the most recent Mortgage that was taken out on this home.
Original Mortgage
$85,000
Interest Rate
8.26%
Mortgage Type
Purchase Money Mortgage
Create a Home Valuation Report for This Property
The Home Valuation Report is an in-depth analysis detailing your home's value as well as a comparison with similar homes in the area
Home Values in the Area
Average Home Value in this Area
Purchase History
| Date | Buyer | Sale Price | Title Company |
|---|---|---|---|
| Kelly Scott W | $111,000 | -- |
Source: Public Records
Mortgage History
| Date | Status | Borrower | Loan Amount |
|---|---|---|---|
| Open | Kelly Scott W | $259,462 | |
| Closed | Kelly Scott W | $115,000 | |
| Closed | Kelly Scott W | $17,000 | |
| Closed | Kelly Scott W | $85,000 |
Source: Public Records
Tax History
| Year | Tax Paid | Tax Assessment Tax Assessment Total Assessment is a certain percentage of the fair market value that is determined by local assessors to be the total taxable value of land and additions on the property. | Land | Improvement |
|---|---|---|---|---|
| 2025 | $9,123 | $556,300 | $245,500 | $310,800 |
| 2024 | $8,543 | $520,300 | $226,700 | $293,600 |
| 2023 | $8,147 | $465,800 | $180,700 | $285,100 |
| 2022 | $8,305 | $439,900 | $193,800 | $246,100 |
| 2021 | $7,377 | $376,000 | $167,500 | $208,500 |
| 2020 | $7,200 | $357,500 | $156,600 | $200,900 |
| 2019 | $6,354 | $339,800 | $144,700 | $195,100 |
| 2018 | $6,123 | $339,800 | $144,700 | $195,100 |
| 2017 | $5,646 | $306,500 | $131,400 | $175,100 |
| 2016 | $5,345 | $306,500 | $131,400 | $175,100 |
| 2015 | $5,211 | $306,500 | $131,400 | $175,100 |
Source: Public Records
Map
Nearby Homes
Your Personal Tour Guide
Ask me questions while you tour the home.