Estimated Value: $215,000 - $332,000
8
Beds
4
Baths
3,352
Sq Ft
$85/Sq Ft
Est. Value
About This Home
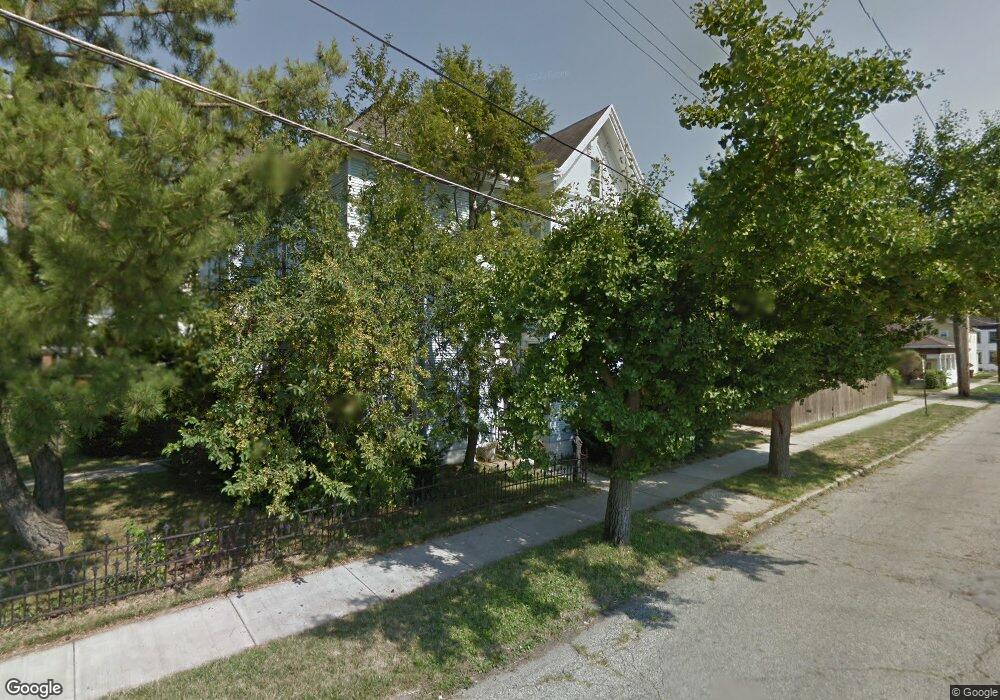
This home is located at 253 W 2nd St, Xenia, OH 45385 and is currently estimated at $285,972, approximately $85 per square foot. 253 W 2nd St is a home located in Greene County with nearby schools including Xenia High School, Summit Academy Community School for Alternative Learners - Xenia, and Legacy Christian Academy.
Ownership History
Date
Name
Owned For
Owner Type
Purchase Details
Closed on
Aug 29, 2025
Sold by
Pdk Holdings Llc and Moore Eric Lynn
Bought by
Moore Tabetha Christine
Current Estimated Value
Home Financials for this Owner
Home Financials are based on the most recent Mortgage that was taken out on this home.
Original Mortgage
$185,000
Interest Rate
6.5%
Mortgage Type
New Conventional
Purchase Details
Closed on
Aug 6, 2021
Sold by
Pdk Holdings Llc
Bought by
Moore Eric and Moore Tabetha
Home Financials for this Owner
Home Financials are based on the most recent Mortgage that was taken out on this home.
Original Mortgage
$238,500
Interest Rate
3%
Mortgage Type
Land Contract Argmt. Of Sale
Purchase Details
Closed on
Apr 23, 2015
Sold by
The Board Of Greene County Commissioners
Bought by
Pdk Holdings Llc
Create a Home Valuation Report for This Property
The Home Valuation Report is an in-depth analysis detailing your home's value as well as a comparison with similar homes in the area
Home Values in the Area
Average Home Value in this Area
Purchase History
| Date | Buyer | Sale Price | Title Company |
|---|---|---|---|
| Moore Tabetha Christine | $240,000 | None Listed On Document | |
| Moore Eric | $240,000 | None Available | |
| Pdk Holdings Llc | -- | None Available |
Source: Public Records
Mortgage History
| Date | Status | Borrower | Loan Amount |
|---|---|---|---|
| Previous Owner | Moore Tabetha Christine | $185,000 | |
| Previous Owner | Moore Eric | $238,500 |
Source: Public Records
Tax History Compared to Growth
Tax History
| Year | Tax Paid | Tax Assessment Tax Assessment Total Assessment is a certain percentage of the fair market value that is determined by local assessors to be the total taxable value of land and additions on the property. | Land | Improvement |
|---|---|---|---|---|
| 2024 | $3,382 | $79,030 | $4,890 | $74,140 |
| 2023 | $3,382 | $79,030 | $4,890 | $74,140 |
| 2022 | $2,954 | $58,880 | $3,910 | $54,970 |
| 2021 | $2,994 | $58,880 | $3,910 | $54,970 |
| 2020 | $2,868 | $58,880 | $3,910 | $54,970 |
| 2019 | $2,441 | $47,170 | $4,130 | $43,040 |
| 2018 | $2,450 | $47,170 | $4,130 | $43,040 |
| 2017 | $2,330 | $47,170 | $4,130 | $43,040 |
| 2016 | $2,331 | $44,030 | $4,130 | $39,900 |
| 2015 | -- | $44,030 | $4,130 | $39,900 |
| 2014 | -- | $44,030 | $4,130 | $39,900 |
Source: Public Records
Map
Nearby Homes