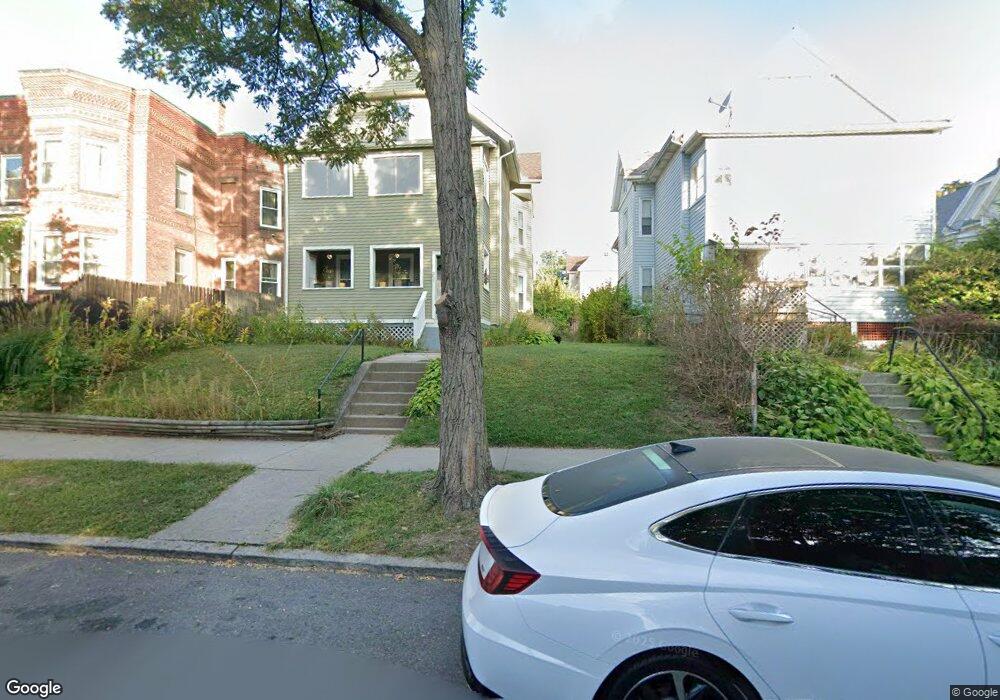
253 Walnut St Unit 255 Holyoke, MA 01040
Estimated Value: $216,000 - $329,000
8
Beds
2
Baths
4,652
Sq Ft
$56/Sq Ft
Est. Value
About This Home
This home is located at 253 Walnut St Unit 255, Holyoke, MA 01040 and is currently estimated at $262,530, approximately $56 per square foot. 253 Walnut St Unit 255 is a home located in Hampden County with nearby schools including H.B. Lawrence Elementary School, Holyoke High School, and Mater Dolorosa Elementary School.
Ownership History
Date
Name
Owned For
Owner Type
Purchase Details
Closed on
Aug 6, 1998
Sold by
Jamlip Corp
Bought by
Leonard Charles E
Current Estimated Value
Home Financials for this Owner
Home Financials are based on the most recent Mortgage that was taken out on this home.
Original Mortgage
$42,250
Outstanding Balance
$8,814
Interest Rate
6.92%
Mortgage Type
Purchase Money Mortgage
Estimated Equity
$253,716
Create a Home Valuation Report for This Property
The Home Valuation Report is an in-depth analysis detailing your home's value as well as a comparison with similar homes in the area
Home Values in the Area
Average Home Value in this Area
Purchase History
| Date | Buyer | Sale Price | Title Company |
|---|---|---|---|
| Leonard Charles E | $65,000 | -- | |
| Jamlip Corp | $15,000 | -- |
Source: Public Records
Mortgage History
| Date | Status | Borrower | Loan Amount |
|---|---|---|---|
| Open | Jamlip Corp | $42,250 | |
| Previous Owner | Jamlip Corp | $64,000 | |
| Previous Owner | Jamlip Corp | $10,446 | |
| Closed | Jamlip Corp | $22,750 |
Source: Public Records
Tax History
| Year | Tax Paid | Tax Assessment Tax Assessment Total Assessment is a certain percentage of the fair market value that is determined by local assessors to be the total taxable value of land and additions on the property. | Land | Improvement |
|---|---|---|---|---|
| 2025 | $4,370 | $250,300 | $36,200 | $214,100 |
| 2024 | $4,034 | $212,900 | $34,400 | $178,500 |
| 2023 | $3,714 | $198,000 | $34,400 | $163,600 |
| 2022 | $3,731 | $193,700 | $34,400 | $159,300 |
| 2021 | $3,241 | $168,200 | $32,200 | $136,000 |
| 2020 | $3,007 | $157,600 | $32,200 | $125,400 |
| 2019 | $1,740 | $90,200 | $28,500 | $61,700 |
| 2018 | $1,284 | $67,100 | $28,500 | $38,600 |
| 2017 | $1,286 | $67,100 | $28,500 | $38,600 |
| 2016 | $1,222 | $63,900 | $27,000 | $36,900 |
| 2015 | $1,217 | $63,900 | $27,000 | $36,900 |
Source: Public Records
Map
Nearby Homes
- 215 Elm St
- 225 Beech St Unit 227
- 329 Beech St
- 13 Hampshire St
- 11 Hampshire St
- 301-303 Linden St
- 201 Locust St
- 219 Suffolk St
- 140 Sycamore St
- 0 High St
- 15-17 Oconnor Ave
- 1137 Dwight St Unit C
- 141 Saint Jerome Ave
- 63 Pine St
- 199 Clemente St
- 207 Clemente St
- 268-270 Sargeant St
- 69 Gates St
- 60 Chapin St Unit D
- 41 Lynwood Ave
Your Personal Tour Guide
Ask me questions while you tour the home.