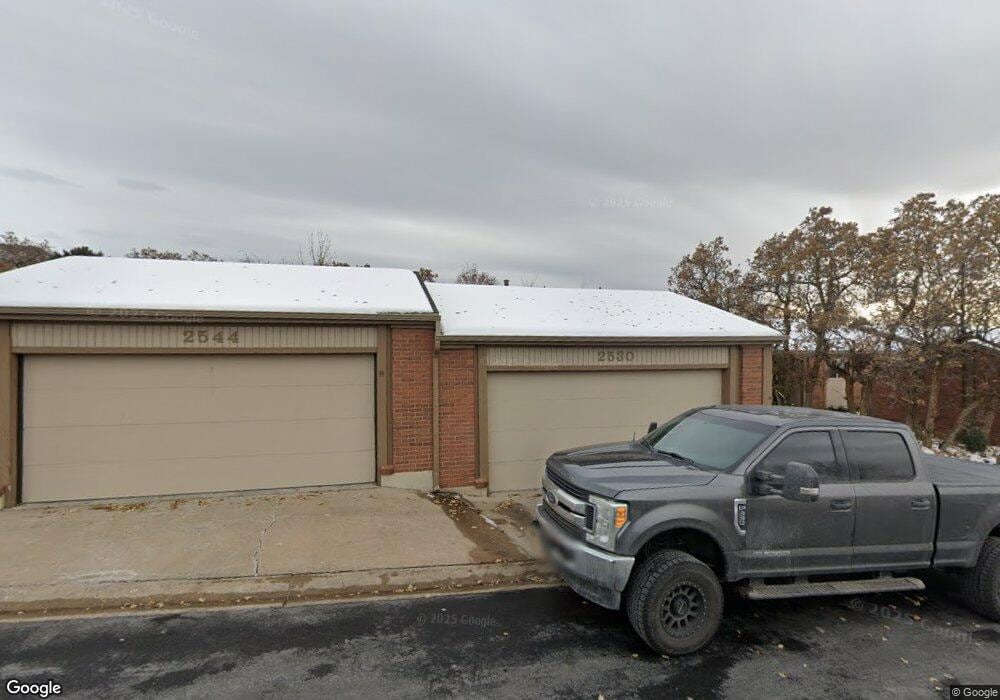
2530 E 1900 N Layton, UT 84040
Estimated Value: $409,000 - $548,000
5
Beds
3
Baths
3,046
Sq Ft
$150/Sq Ft
Est. Value
About This Home
This home is located at 2530 E 1900 N, Layton, UT 84040 and is currently estimated at $456,545, approximately $149 per square foot. 2530 E 1900 N is a home located in Davis County with nearby schools including East Layton Elementary School, Central Davis Junior High School, and Northridge High School.
Ownership History
Date
Name
Owned For
Owner Type
Purchase Details
Closed on
Apr 5, 2024
Sold by
Patel Properties Inc
Bought by
Olson Kathryn and Quirarte Jose F
Current Estimated Value
Home Financials for this Owner
Home Financials are based on the most recent Mortgage that was taken out on this home.
Original Mortgage
$383,920
Outstanding Balance
$377,852
Interest Rate
6.9%
Mortgage Type
New Conventional
Estimated Equity
$78,693
Purchase Details
Closed on
Oct 20, 2022
Sold by
Norma Anderson Wall Revocable Living Tru
Bought by
Patel Properties Llc
Purchase Details
Closed on
Feb 14, 2007
Sold by
Wall Norma Anderson
Bought by
Wall Norma Anderson and Norma Anderson Wall Revocable Trust
Purchase Details
Closed on
Mar 4, 2005
Sold by
Wall Norman and Davis Layton
Bought by
Wall Norma Andarson and Norma Anderson Wall Revocable Living Tru
Create a Home Valuation Report for This Property
The Home Valuation Report is an in-depth analysis detailing your home's value as well as a comparison with similar homes in the area
Home Values in the Area
Average Home Value in this Area
Purchase History
| Date | Buyer | Sale Price | Title Company |
|---|---|---|---|
| Olson Kathryn | -- | Metro National Title | |
| Patel Properties Llc | -- | Metro National Title | |
| Wall Norma Anderson | -- | None Available | |
| Wall Norma Andarson | -- | None Available | |
| Wall Norma | -- | Invest Title Services Inc |
Source: Public Records
Mortgage History
| Date | Status | Borrower | Loan Amount |
|---|---|---|---|
| Open | Olson Kathryn | $383,920 |
Source: Public Records
Tax History
| Year | Tax Paid | Tax Assessment Tax Assessment Total Assessment is a certain percentage of the fair market value that is determined by local assessors to be the total taxable value of land and additions on the property. | Land | Improvement |
|---|---|---|---|---|
| 2025 | $2,269 | $228,250 | $0 | $228,250 |
| 2024 | $2,208 | $224,950 | $0 | $224,950 |
| 2023 | $2,027 | $200,750 | $0 | $200,750 |
| 2022 | $2,115 | $207,350 | $52,250 | $155,100 |
| 2021 | $345 | $279,000 | $71,000 | $208,000 |
| 2020 | $265 | $228,000 | $53,800 | $174,200 |
| 2019 | $270 | $223,000 | $51,700 | $171,300 |
| 2018 | $218 | $196,000 | $39,500 | $156,500 |
| 2016 | $250 | $96,360 | $21,725 | $74,635 |
| 2015 | $1,295 | $88,220 | $21,725 | $66,495 |
| 2014 | $182 | $93,889 | $18,333 | $75,556 |
| 2013 | -- | $85,338 | $18,700 | $66,638 |
Source: Public Records
Map
Nearby Homes
- 2547 E 1900 N
- 2509 E 1900 N
- 1954 N 2600 E
- 2391 Kays Creek Dr
- 1907 N Bridge Ct
- 2136 N 2800 E
- 2563 E 2250 N
- 1752 N Valley View Dr
- 2231 N Valley View Dr
- 1870 N Valley View Dr Unit 201
- 1332 N 2350 E
- 2124 E Cherry Ln
- 2340 N 2050 E
- 1975 E 1425 N
- 2273 N 1975 E
- 1843 Hayes Dr
- 2597 N 2300 E
- 2203 E 1200 N
- 2189 N 1950 E
- 2113 E 1200 N
Your Personal Tour Guide
Ask me questions while you tour the home.