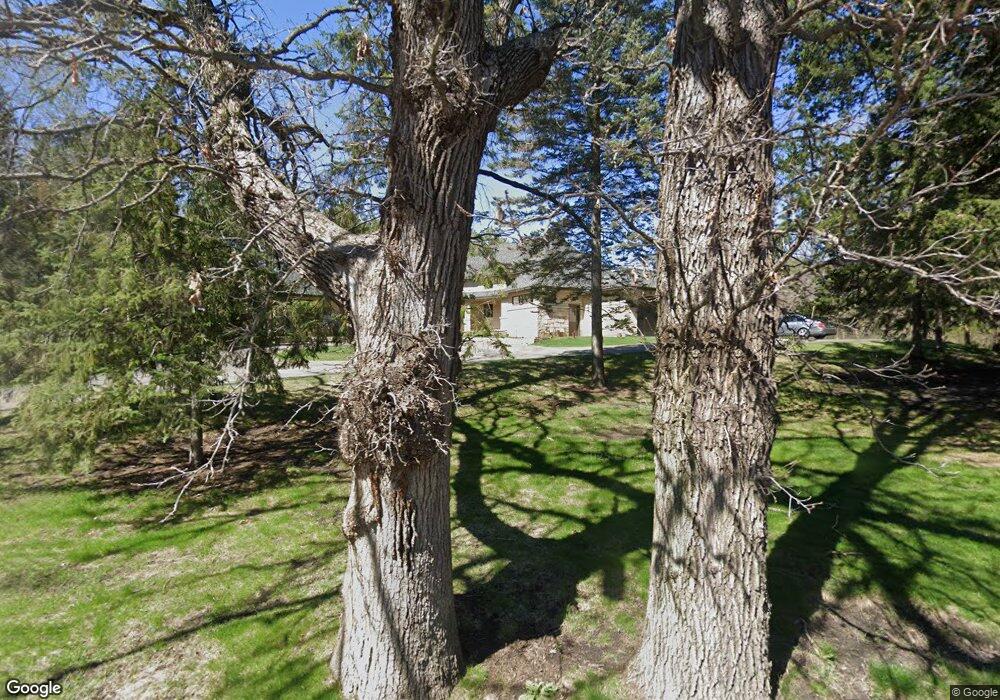
2530 Fox St Wayzata, MN 55391
Estimated Value: $1,820,000 - $2,183,000
4
Beds
5
Baths
2,950
Sq Ft
$670/Sq Ft
Est. Value
About This Home
This home is located at 2530 Fox St, Wayzata, MN 55391 and is currently estimated at $1,975,872, approximately $669 per square foot. 2530 Fox St is a home located in Hennepin County with nearby schools including Schumann Elementary School, Orono Intermediate Elementary School, and Orono Middle School.
Ownership History
Date
Name
Owned For
Owner Type
Purchase Details
Closed on
Oct 20, 2021
Sold by
Witt Julie Ann and Witt Robert F
Bought by
Vimal Ashish U and Marshall Julia E
Current Estimated Value
Home Financials for this Owner
Home Financials are based on the most recent Mortgage that was taken out on this home.
Original Mortgage
$1,344,000
Outstanding Balance
$1,225,603
Interest Rate
2.8%
Mortgage Type
New Conventional
Estimated Equity
$750,269
Purchase Details
Closed on
Mar 28, 2003
Sold by
Macmillan Donald C
Bought by
Johnson Julie Ann
Purchase Details
Closed on
May 31, 2002
Sold by
Macmillan Donald C
Bought by
Johnson Julie Ann
Purchase Details
Closed on
May 17, 1999
Sold by
Armajani Barbara
Bought by
Macmillan Donald C and Donald C Macmillan Trust
Purchase Details
Closed on
Jun 22, 1996
Sold by
Smith William F and Vervoort Smith Jennifer E
Bought by
Armajani Barbara and Armajani Siah
Create a Home Valuation Report for This Property
The Home Valuation Report is an in-depth analysis detailing your home's value as well as a comparison with similar homes in the area
Home Values in the Area
Average Home Value in this Area
Purchase History
We collect this data history from publicly available records. To have your information removed, we recommend requesting removal directly through your county’s website.
| Date | Buyer | Sale Price | Title Company |
|---|---|---|---|
| Vimal Ashish U | $1,680,000 | Burnet Title | |
| Johnson Julie Ann | $410,000 | -- | |
| Johnson Julie Ann | $410,000 | -- | |
| Macmillan Donald C | $287,500 | -- | |
| Armajani Barbara | $200,000 | -- |
Source: Public Records
Mortgage History
We collect this data history from publicly available records. To have your information removed, we recommend requesting removal directly through your county’s website.
| Date | Status | Borrower | Loan Amount |
|---|---|---|---|
| Open | Vimal Ashish U | $1,344,000 | |
| Closed | Johnson Julie Ann | -- |
Source: Public Records
Tax History
| Year | Tax Paid | Tax Assessment Tax Assessment Total Assessment is a certain percentage of the fair market value that is determined by local assessors to be the total taxable value of land and additions on the property. | Land | Improvement |
|---|---|---|---|---|
| 2024 | $20,463 | $1,808,000 | $676,500 | $1,131,500 |
| 2023 | $20,013 | $1,834,800 | $701,300 | $1,133,500 |
| 2022 | $16,536 | $1,613,000 | $528,000 | $1,085,000 |
| 2021 | $16,232 | $1,357,000 | $454,000 | $903,000 |
| 2020 | $16,035 | $1,337,000 | $454,000 | $883,000 |
| 2019 | $19,431 | $1,268,000 | $408,000 | $860,000 |
| 2018 | $18,704 | $1,496,000 | $463,000 | $1,033,000 |
| 2017 | $19,200 | $1,435,000 | $426,000 | $1,009,000 |
| 2016 | $16,277 | $1,229,000 | $370,000 | $859,000 |
| 2015 | $14,952 | $1,137,000 | $278,000 | $859,000 |
| 2014 | -- | $1,179,000 | $342,000 | $837,000 |
Source: Public Records
Map
Nearby Homes
- 2420 Fox St
- 505 S Willow Dr
- 450 S Willow Dr
- 2780 White Oak Cir
- 405 S Old Crystal Bay Rd
- 1000 Old Crystal Bay Rd S
- 2350 Longview Cir
- 1100 Old Crystal Bay Rd
- 2845 Watertown Rd
- 940 Brown Rd S
- 3280 Fox St
- 58 Inglewood St
- 3215 Graham Hill Rd
- 425 Oxford Rd
- 134 Inglewood St
- 275 Crestview Ave
- 1155 Heritage Ln
- 1000 Heritage Ln
- 1395 Brown Rd S
- 195 Crystal Creek Rd
Your Personal Tour Guide
Ask me questions while you tour the home.