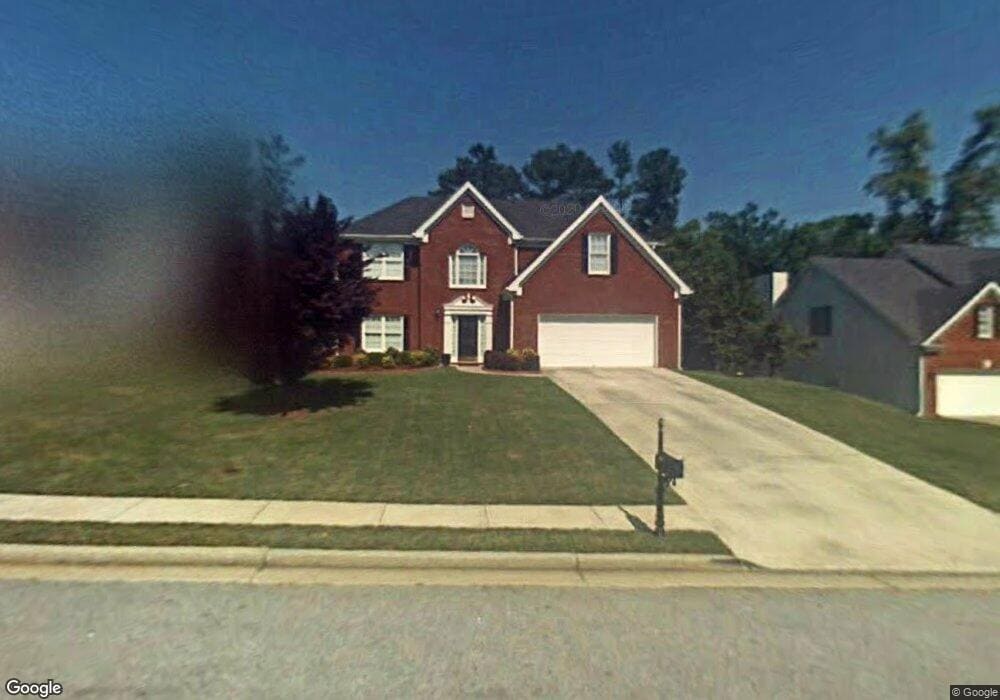
2530 Potomac View Ct Grayson, GA 30017
Estimated Value: $412,125 - $427,000
4
Beds
3
Baths
2,334
Sq Ft
$180/Sq Ft
Est. Value
About This Home
This home is located at 2530 Potomac View Ct, Grayson, GA 30017 and is currently estimated at $419,031, approximately $179 per square foot. 2530 Potomac View Ct is a home located in Gwinnett County with nearby schools including Grayson Elementary School, Bay Creek Middle School, and Grayson High School.
Ownership History
Date
Name
Owned For
Owner Type
Purchase Details
Closed on
Dec 14, 2010
Sold by
Fleming Loranzo M
Bought by
Boulanger Joseph M and Boulanger Lauren L
Current Estimated Value
Home Financials for this Owner
Home Financials are based on the most recent Mortgage that was taken out on this home.
Original Mortgage
$116,000
Outstanding Balance
$76,431
Interest Rate
4.32%
Mortgage Type
New Conventional
Estimated Equity
$342,600
Purchase Details
Closed on
Oct 31, 2002
Sold by
Shiflett Chris L
Bought by
Fleming Loranzo M
Home Financials for this Owner
Home Financials are based on the most recent Mortgage that was taken out on this home.
Original Mortgage
$187,460
Interest Rate
5.89%
Mortgage Type
VA
Purchase Details
Closed on
Aug 31, 2000
Sold by
B & C Homebuilders Inc
Bought by
Shiflett Chris L
Home Financials for this Owner
Home Financials are based on the most recent Mortgage that was taken out on this home.
Original Mortgage
$158,000
Interest Rate
10.88%
Mortgage Type
New Conventional
Create a Home Valuation Report for This Property
The Home Valuation Report is an in-depth analysis detailing your home's value as well as a comparison with similar homes in the area
Home Values in the Area
Average Home Value in this Area
Purchase History
| Date | Buyer | Sale Price | Title Company |
|---|---|---|---|
| Boulanger Joseph M | $145,000 | -- | |
| Fleming Loranzo M | $182,000 | -- | |
| Shiflett Chris L | $197,500 | -- |
Source: Public Records
Mortgage History
| Date | Status | Borrower | Loan Amount |
|---|---|---|---|
| Open | Boulanger Joseph M | $116,000 | |
| Previous Owner | Fleming Loranzo M | $187,460 | |
| Previous Owner | Shiflett Chris L | $158,000 |
Source: Public Records
Tax History Compared to Growth
Tax History
| Year | Tax Paid | Tax Assessment Tax Assessment Total Assessment is a certain percentage of the fair market value that is determined by local assessors to be the total taxable value of land and additions on the property. | Land | Improvement |
|---|---|---|---|---|
| 2025 | $5,583 | $148,560 | $36,000 | $112,560 |
| 2024 | $5,493 | $144,320 | $36,000 | $108,320 |
| 2023 | $5,493 | $150,240 | $34,800 | $115,440 |
| 2022 | $4,798 | $125,680 | $29,200 | $96,480 |
| 2021 | $3,916 | $99,400 | $23,600 | $75,800 |
| 2020 | $3,743 | $94,040 | $23,600 | $70,440 |
| 2019 | $3,488 | $90,680 | $22,000 | $68,680 |
| 2018 | $3,352 | $86,720 | $22,000 | $64,720 |
| 2016 | $2,889 | $73,040 | $16,160 | $56,880 |
| 2015 | $2,920 | $73,040 | $16,160 | $56,880 |
| 2014 | $2,782 | $68,880 | $14,360 | $54,520 |
Source: Public Records
Map
Nearby Homes
- 2520 Potomac View Ct
- 1523 Grayson Pkwy
- 1515 Grayson Pkwy
- 2531 Falcon Ridge Dr
- 2490 Turtle Terrace
- 2538 Three Bars Dr
- 2210 Ridgedale Dr SW
- 1545 Falcon Ln
- 1750 Arborwood Dr Unit 1
- 2348 Radbury Ln
- 465 Brown Dove Ln
- 1335 Tullifenney Ct SW
- 2135 Pinella Dr
- 2542 Haynes Meadow Ct
- 2187 Chaparral Dr
- 2183 Chaparral Dr
- 2274 Amber Woods Dr
- 2540 Potomac View Ct
- 2550 Potomac View Ct
- 2510 Potomac View Ct
- 2535 Potomac View Ct Unit 1
- 2545 Potomac View Ct
- 2525 Potomac View Ct
- 2500 Potomac View Ct
- 2560 Potomac View Ct Unit 84
- 2560 Potomac View Ct
- 2555 Potomac View Ct
- 2515 Potomac View Ct Unit 89
- 2515 Potomac View Ct
- 1800 Gleneden Ct
- 2490 Potomac View Ct Unit 1
- 1615 Terry Mill Ln Unit 1
- 2505 Potomac View Ct
- 1625 Terry Mill Ln
- 1810 Gleneden Ct
- 0 Gleneden Ct SW Unit 7630869
- 0 Gleneden Ct SW Unit 7614480