Estimated Value: $400,000 - $423,324
5
Beds
2
Baths
2,246
Sq Ft
$183/Sq Ft
Est. Value
About This Home
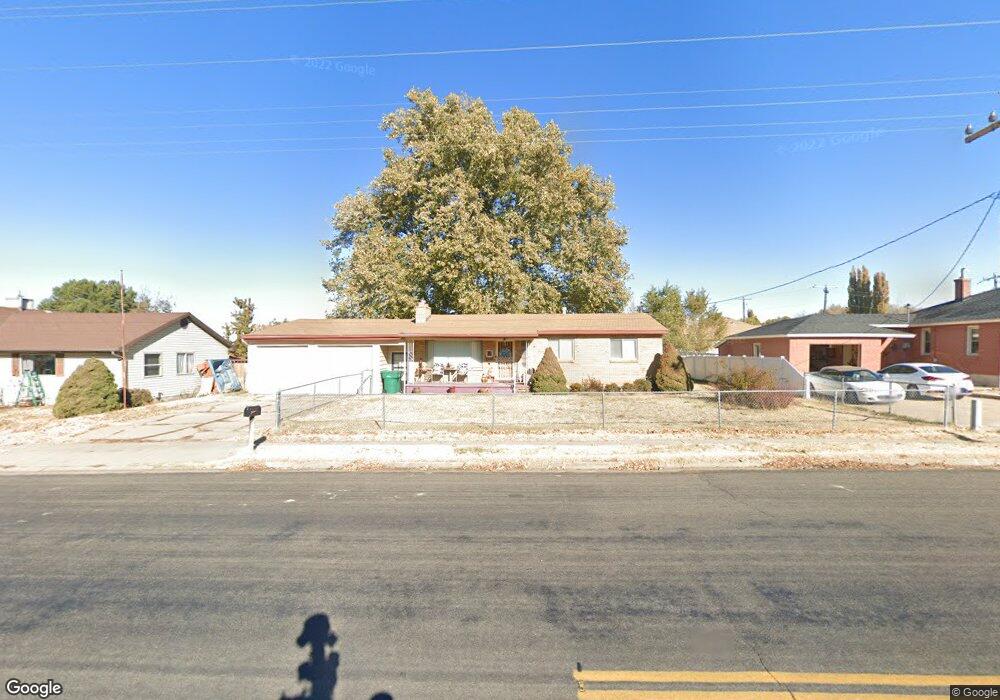
This home is located at 2530 W 6000 S, Roy, UT 84067 and is currently estimated at $410,081, approximately $182 per square foot. 2530 W 6000 S is a home located in Weber County with nearby schools including Roy Elementary School, Roy Junior High School, and Roy High School.
Ownership History
Date
Name
Owned For
Owner Type
Purchase Details
Closed on
Feb 28, 2014
Sold by
Bank Of Utah and Meyer Ira Ritchie W
Bought by
Barba Ernesto and Heu Song
Current Estimated Value
Home Financials for this Owner
Home Financials are based on the most recent Mortgage that was taken out on this home.
Original Mortgage
$7,297
Outstanding Balance
$5,484
Interest Rate
4.12%
Mortgage Type
FHA
Estimated Equity
$404,597
Purchase Details
Closed on
Sep 6, 2013
Sold by
Palfreyman Dan and Palfreyman Susan
Bought by
Bank Of Utah and Meyer Ira Ritchie W
Purchase Details
Closed on
Aug 28, 1998
Sold by
Bambrough Verna Russell and Kimber Albert Wayne
Bought by
Bambrough Verna Russell
Purchase Details
Closed on
Apr 17, 1997
Sold by
Bambrough Verna Russell and Kimber Albert Wayne
Bought by
Bambrough Verna Russell
Create a Home Valuation Report for This Property
The Home Valuation Report is an in-depth analysis detailing your home's value as well as a comparison with similar homes in the area
Home Values in the Area
Average Home Value in this Area
Purchase History
| Date | Buyer | Sale Price | Title Company |
|---|---|---|---|
| Barba Ernesto | -- | Mountain View Title Ogden | |
| Bank Of Utah | $108,047 | None Available | |
| Bambrough Verna Russell | -- | -- | |
| Bambrough Verna Russell | -- | -- |
Source: Public Records
Mortgage History
| Date | Status | Borrower | Loan Amount |
|---|---|---|---|
| Open | Barba Ernesto | $7,297 |
Source: Public Records
Tax History Compared to Growth
Tax History
| Year | Tax Paid | Tax Assessment Tax Assessment Total Assessment is a certain percentage of the fair market value that is determined by local assessors to be the total taxable value of land and additions on the property. | Land | Improvement |
|---|---|---|---|---|
| 2025 | $2,666 | $422,341 | $109,920 | $312,421 |
| 2024 | $2,573 | $410,000 | $109,937 | $300,063 |
| 2023 | $2,336 | $370,000 | $101,294 | $268,706 |
| 2022 | $2,502 | $411,000 | $97,677 | $313,323 |
| 2021 | $1,986 | $293,000 | $63,863 | $229,137 |
| 2020 | $1,755 | $236,000 | $63,863 | $172,137 |
| 2019 | $1,762 | $224,000 | $39,940 | $184,060 |
| 2018 | $1,615 | $192,000 | $35,266 | $156,734 |
| 2017 | $1,568 | $175,000 | $37,921 | $137,079 |
| 2016 | $1,390 | $82,338 | $20,323 | $62,015 |
| 2015 | $1,328 | $80,709 | $23,090 | $57,619 |
| 2014 | $1,234 | $73,358 | $17,516 | $55,842 |
Source: Public Records
Map
Nearby Homes
- 2546 W 6000 S
- 2516 W 6000 S
- 2567 W 5950 S Unit 5
- 2567 W 5950 S
- 2565 W 5950 S Unit 4
- 2565 W 5950 S
- 2569 W 5950 S Unit 6
- 2569 W 5950 S
- 2554 W 6000 S
- 2563 W 5950 S Unit 3
- 2563 W 5950 S
- 6004 S 2550 W
- 2496 W 6000 S
- 2486 W 6000 S
- 2523 W 6000 S
- 2571 W 5950 S
- 6003 S 2550 W
- 2561 W 5950 S
- 2561 W 6000 S
- 2570 W 6000 S