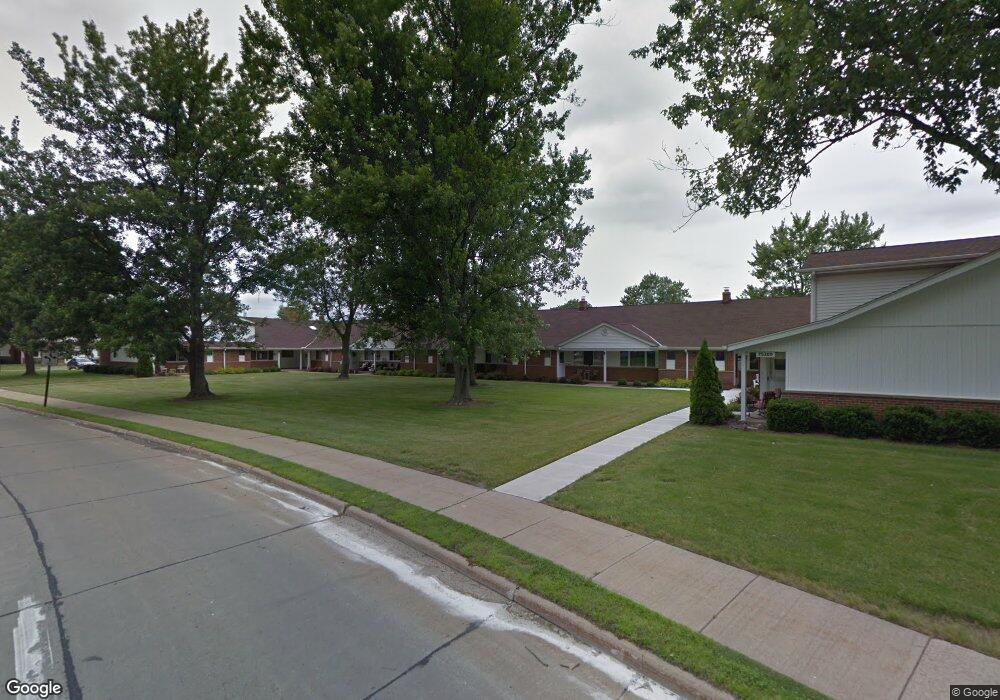
25300 Country Club Blvd North Olmsted, OH 44070
Estimated Value: $146,165 - $159,000
2
Beds
2
Baths
1,352
Sq Ft
$113/Sq Ft
Est. Value
About This Home
This home is located at 25300 Country Club Blvd, North Olmsted, OH 44070 and is currently estimated at $153,041, approximately $113 per square foot. 25300 Country Club Blvd is a home located in Cuyahoga County with nearby schools including Pine Intermediate School, Chestnut Intermediate Elementary School, and North Olmsted Middle School.
Ownership History
Date
Name
Owned For
Owner Type
Purchase Details
Closed on
Aug 28, 2015
Sold by
Forbes Arthur W and Forbes Yoneko
Bought by
Pehotsky Sandra T
Current Estimated Value
Purchase Details
Closed on
Nov 29, 2013
Sold by
Forbes Of Tara Lynn Llc
Bought by
Forbes Family Revocable Living Trust
Purchase Details
Closed on
Oct 11, 2007
Sold by
Thomson Laurie
Bought by
Forbes Arthur W and Forbes Yoneko
Purchase Details
Closed on
Jan 17, 2007
Sold by
Forbes Arthur W and Forbes Yoneko
Bought by
Forbes Of Tara Lynn Llc
Purchase Details
Closed on
Sep 30, 1977
Sold by
Williams James R
Bought by
Schraff Rosanne M
Purchase Details
Closed on
Dec 1, 1975
Bought by
Valley Investments
Purchase Details
Closed on
Jan 1, 1975
Bought by
Condominium Conversions
Create a Home Valuation Report for This Property
The Home Valuation Report is an in-depth analysis detailing your home's value as well as a comparison with similar homes in the area
Home Values in the Area
Average Home Value in this Area
Purchase History
| Date | Buyer | Sale Price | Title Company |
|---|---|---|---|
| Pehotsky Sandra T | -- | Attorney | |
| Forbes Family Revocable Living Trust | -- | Attorney | |
| Forbes Arthur W | $69,000 | Express Title Agency Llc | |
| Forbes Of Tara Lynn Llc | -- | Attorney | |
| Schraff Rosanne M | $31,000 | -- | |
| Williams James R | -- | -- | |
| Valley Investments | -- | -- | |
| Condominium Conversions | -- | -- |
Source: Public Records
Tax History Compared to Growth
Tax History
| Year | Tax Paid | Tax Assessment Tax Assessment Total Assessment is a certain percentage of the fair market value that is determined by local assessors to be the total taxable value of land and additions on the property. | Land | Improvement |
|---|---|---|---|---|
| 2024 | $2,828 | $40,425 | $4,025 | $36,400 |
| 2023 | $2,151 | $25,800 | $2,590 | $23,210 |
| 2022 | $2,140 | $25,800 | $2,590 | $23,210 |
| 2021 | $1,942 | $25,800 | $2,590 | $23,210 |
| 2020 | $1,660 | $19,530 | $1,960 | $17,570 |
| 2019 | $1,616 | $55,800 | $5,600 | $50,200 |
| 2018 | $1,572 | $19,530 | $1,960 | $17,570 |
| 2017 | $1,529 | $16,770 | $1,680 | $15,090 |
| 2016 | $1,516 | $16,770 | $1,680 | $15,090 |
| 2015 | $1,754 | $16,770 | $1,680 | $15,090 |
| 2014 | $1,754 | $19,290 | $1,930 | $17,360 |
Source: Public Records
Map
Nearby Homes
- 26902 Butternut Ridge Rd
- 31 Vista Cir Unit A
- 274 Vista Cir Unit B
- 25735 Lorain Rd Unit 218
- 25735 Lorain Rd Unit 121
- 385 Vista Cir
- 26726 Leenders Ln
- 8 Golf View Ln
- 27693 Butternut Ridge
- 4429 Canterbury Rd
- 25118 Carey Ln
- 0 V L Clareshire Dr
- 5308 Columbia Rd
- 5943 Porter Rd
- 4553 Porter Rd
- 26646 Sweetbriar Dr
- 27504 Cottonwood Trail
- 5248 W Park Dr
- 24300 Mastick Rd
- 24326 Mastick Rd
- 25300 Country Club Blvd Unit 4-14
- 25300 Country Club Blvd
- 25300 Country Club Blvd
- 25300 Country Club Blvd
- 25300 Country Club Blvd
- 25300 Country Club Blvd
- 25300 Country Club Blvd
- 25300 Country Club Blvd
- 25300 Country Club Blvd
- 25300 Country Club Blvd
- 25300 Country Club Blvd
- 25300 Country Club Blvd
- 25300 Country Club Blvd
- 25300 Country Club Blvd
- 25300 Country Club Blvd
- 25300 Country Club Blvd
- 25300 Country Club Blvd
- 25300 Country Club Blvd
- 25300 Country Club Blvd
- 25300 Country Club Blvd