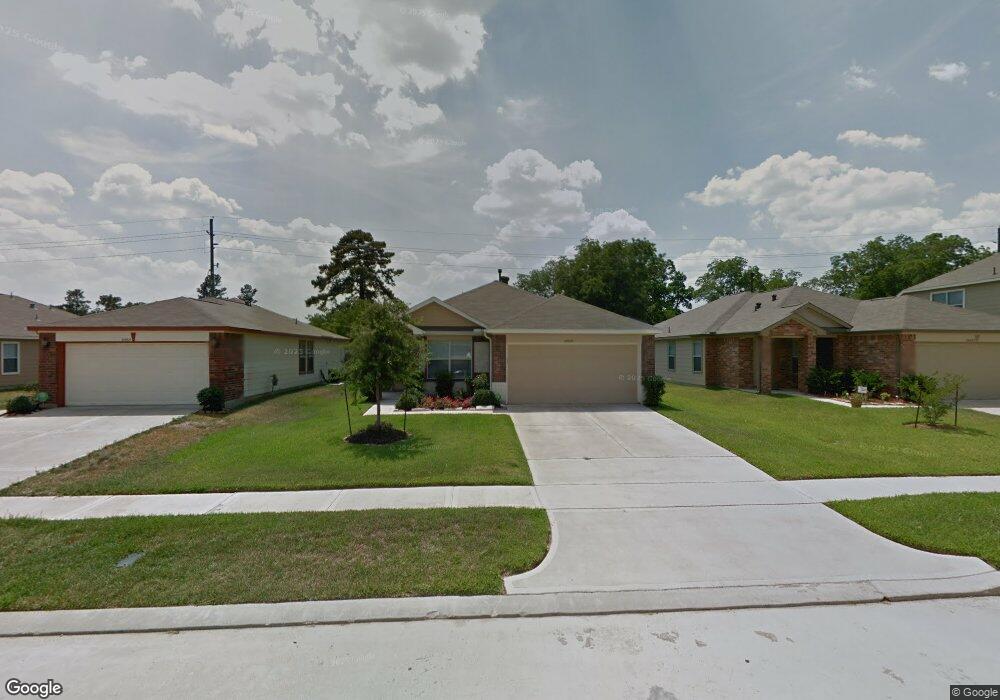
25319 Dappled Filly Dr Tomball, TX 77375
Hufsmith NeighborhoodEstimated Value: $281,607 - $310,000
3
Beds
2
Baths
1,558
Sq Ft
$189/Sq Ft
Est. Value
About This Home
This home is located at 25319 Dappled Filly Dr, Tomball, TX 77375 and is currently estimated at $294,652, approximately $189 per square foot. 25319 Dappled Filly Dr is a home located in Harris County with nearby schools including Metzler Elementary School, Klein Oak High School, and ISCHOOL-CREEKSI.
Ownership History
Date
Name
Owned For
Owner Type
Purchase Details
Closed on
Oct 16, 2019
Sold by
Crawford Brian W and Leverett Jessica L
Bought by
Crawford Brian W and Crawford Jessica
Current Estimated Value
Home Financials for this Owner
Home Financials are based on the most recent Mortgage that was taken out on this home.
Original Mortgage
$162,017
Outstanding Balance
$142,511
Interest Rate
3.7%
Mortgage Type
Stand Alone First
Estimated Equity
$152,141
Purchase Details
Closed on
Nov 25, 2008
Sold by
Trophy Homes
Bought by
Crawford Brian W and Leverett Jessica L
Home Financials for this Owner
Home Financials are based on the most recent Mortgage that was taken out on this home.
Original Mortgage
$131,807
Interest Rate
5.99%
Mortgage Type
FHA
Create a Home Valuation Report for This Property
The Home Valuation Report is an in-depth analysis detailing your home's value as well as a comparison with similar homes in the area
Home Values in the Area
Average Home Value in this Area
Purchase History
| Date | Buyer | Sale Price | Title Company |
|---|---|---|---|
| Crawford Brian W | -- | Servicelink | |
| Crawford Brian W | -- | None Available |
Source: Public Records
Mortgage History
| Date | Status | Borrower | Loan Amount |
|---|---|---|---|
| Open | Crawford Brian W | $162,017 | |
| Closed | Crawford Brian W | $131,807 |
Source: Public Records
Tax History Compared to Growth
Tax History
| Year | Tax Paid | Tax Assessment Tax Assessment Total Assessment is a certain percentage of the fair market value that is determined by local assessors to be the total taxable value of land and additions on the property. | Land | Improvement |
|---|---|---|---|---|
| 2025 | $5,177 | $275,150 | $50,875 | $224,275 |
| 2024 | $5,177 | $268,647 | $50,875 | $217,772 |
| 2023 | $5,177 | $271,303 | $50,875 | $220,428 |
| 2022 | $5,861 | $246,609 | $50,875 | $195,734 |
| 2021 | $5,663 | $211,170 | $30,250 | $180,920 |
| 2020 | $5,383 | $181,644 | $27,500 | $154,144 |
| 2019 | $5,406 | $177,228 | $27,500 | $149,728 |
| 2018 | $2,048 | $168,202 | $27,500 | $140,702 |
| 2017 | $5,236 | $168,202 | $27,500 | $140,702 |
| 2016 | $5,000 | $161,806 | $27,500 | $134,306 |
| 2015 | $3,890 | $161,806 | $27,500 | $134,306 |
| 2014 | $3,890 | $142,517 | $27,500 | $115,017 |
Source: Public Records
Map
Nearby Homes
- 25403 Angelwood Springs Ln
- 25243 Saddlebrook Ranch Dr
- 8910 Stonebriar Creek Crossing
- 25414 Barmby Dr
- 12503 Beddington Ct
- 31111 Spring Lake Blvd
- 8718 Hostler Dr
- 8918 Rollick Dr
- 8939 Headstall Dr
- 8938 Headstall Dr
- 8718 Sandusky Ct
- 8815 Alicia Dr
- 8903 Square View Ln
- 8927 Alcina Dr
- 10 Fringetree Bark
- 8407 Oak Villa Ct
- 8406 Oak Villa Ct
- 25207 Oak Star Dr
- 9219 Trimble Landing Dr
- 9410 Mont Ellie Ln
- 25315 Dappled Filly Dr
- 25323 Dappled Filly Dr
- 25311 Dappled Filly Dr
- 8755 Auburn Mane Dr
- 25403 Dappled Filly Dr
- 25307 Dappled Filly Dr
- 25310 Dappled Filly Dr
- 8751 Auburn Mane Dr
- 25407 Dappled Filly Dr
- 25330 Dappled Filly Dr
- 25310 Angelwood Springs Ln
- 8754 Auburn Mane Dr
- 25303 Dappled Filly Dr
- 25306 Dappled Filly Dr
- 25314 Angelwood Springs Ln
- 25306 Angelwood Springs Ln
- 8747 Auburn Mane Dr
- 25411 Dappled Filly Dr
- 25318 Angelwood Springs Ln
- 8750 Auburn Mane Dr