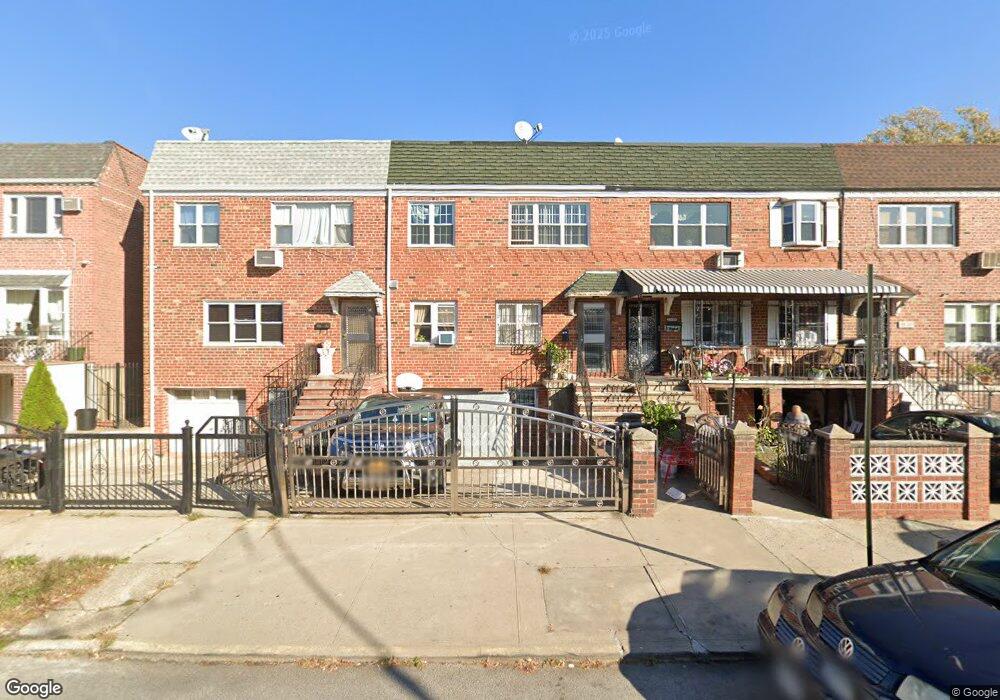
2533 81st St East Elmhurst, NY 11370
Jackson Heights NeighborhoodEstimated Value: $1,191,184 - $1,341,000
--
Bed
--
Bath
2,964
Sq Ft
$434/Sq Ft
Est. Value
About This Home
This home is located at 2533 81st St, East Elmhurst, NY 11370 and is currently estimated at $1,287,046, approximately $434 per square foot. 2533 81st St is a home located in Queens County with nearby schools including P.S. 2 Alfred Zimberg, Is 141 The Steinway, and William Cullen Bryant High School.
Ownership History
Date
Name
Owned For
Owner Type
Purchase Details
Closed on
Dec 28, 2009
Sold by
Hamada Naser
Bought by
Hasib Mohammed and Islam Shazul
Current Estimated Value
Home Financials for this Owner
Home Financials are based on the most recent Mortgage that was taken out on this home.
Original Mortgage
$527,573
Outstanding Balance
$343,382
Interest Rate
4.78%
Mortgage Type
Purchase Money Mortgage
Estimated Equity
$943,664
Purchase Details
Closed on
Jul 10, 2002
Sold by
Cicero Carmelo and Cicero Anna
Bought by
Hamada Naser
Home Financials for this Owner
Home Financials are based on the most recent Mortgage that was taken out on this home.
Original Mortgage
$330,000
Interest Rate
6.27%
Create a Home Valuation Report for This Property
The Home Valuation Report is an in-depth analysis detailing your home's value as well as a comparison with similar homes in the area
Home Values in the Area
Average Home Value in this Area
Purchase History
| Date | Buyer | Sale Price | Title Company |
|---|---|---|---|
| Hasib Mohammed | $610,000 | -- | |
| Hamada Naser | -- | -- |
Source: Public Records
Mortgage History
| Date | Status | Borrower | Loan Amount |
|---|---|---|---|
| Open | Hasib Mohammed | $527,573 | |
| Previous Owner | Hamada Naser | $330,000 |
Source: Public Records
Tax History Compared to Growth
Tax History
| Year | Tax Paid | Tax Assessment Tax Assessment Total Assessment is a certain percentage of the fair market value that is determined by local assessors to be the total taxable value of land and additions on the property. | Land | Improvement |
|---|---|---|---|---|
| 2025 | $9,413 | $51,160 | $5,199 | $45,961 |
| 2024 | $9,425 | $48,264 | $5,532 | $42,732 |
| 2023 | $8,864 | $45,533 | $4,425 | $41,108 |
| 2022 | $8,803 | $67,380 | $7,860 | $59,520 |
| 2021 | $9,214 | $72,060 | $7,860 | $64,200 |
| 2020 | $8,728 | $67,401 | $7,860 | $59,541 |
| 2019 | $8,121 | $71,580 | $7,860 | $63,720 |
| 2018 | $7,437 | $37,944 | $5,299 | $32,645 |
| 2017 | $7,435 | $37,944 | $6,099 | $31,845 |
| 2016 | $7,219 | $37,944 | $6,099 | $31,845 |
| 2015 | $4,311 | $35,528 | $7,956 | $27,572 |
| 2014 | $4,311 | $33,517 | $8,266 | $25,251 |
Source: Public Records
Map
Nearby Homes