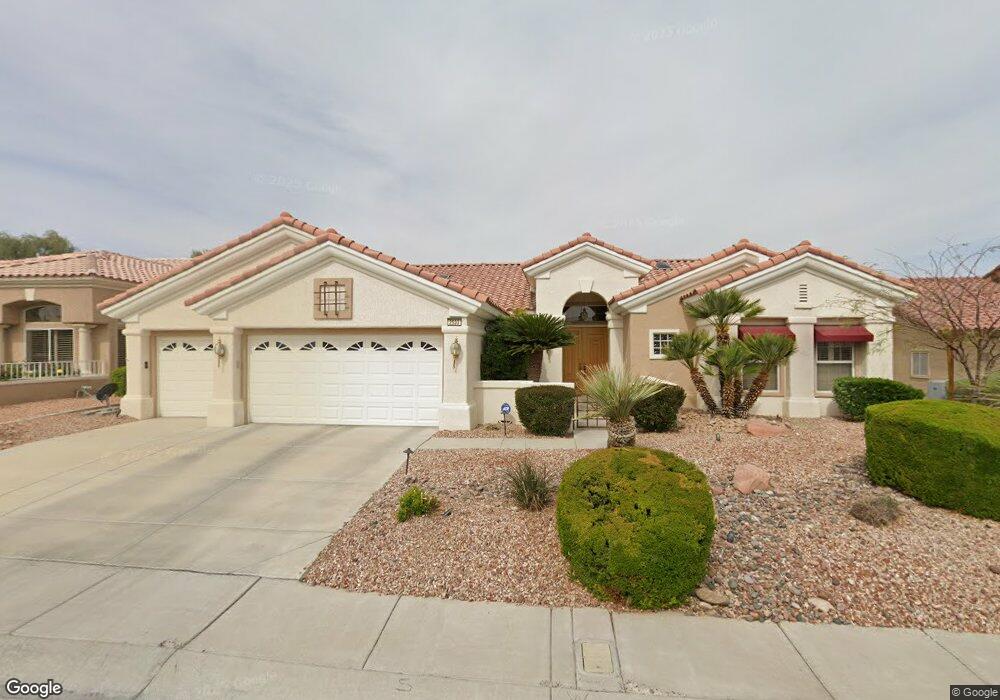
2533 High Range Dr Unit 35 Las Vegas, NV 89134
Sun City Summerlin NeighborhoodEstimated Value: $939,654 - $1,064,000
3
Beds
3
Baths
2,533
Sq Ft
$398/Sq Ft
Est. Value
About This Home
This home is located at 2533 High Range Dr Unit 35, Las Vegas, NV 89134 and is currently estimated at $1,009,164, approximately $398 per square foot. 2533 High Range Dr Unit 35 is a home located in Clark County with nearby schools including William Lummis Elementary School, Ernest Becker Middle School, and Palo Verde High School.
Ownership History
Date
Name
Owned For
Owner Type
Purchase Details
Closed on
Feb 7, 2020
Sold by
Yao Neng Ping and Yao Ruey Yi
Bought by
Yao Neng Ping and Yao Ruey Yi
Current Estimated Value
Purchase Details
Closed on
Jul 27, 2004
Sold by
Harris Revocable Family Trust
Bought by
Yao Neng Ping and Yao Ruey Yi
Home Financials for this Owner
Home Financials are based on the most recent Mortgage that was taken out on this home.
Original Mortgage
$480,000
Outstanding Balance
$242,594
Interest Rate
6.29%
Mortgage Type
Credit Line Revolving
Estimated Equity
$766,570
Purchase Details
Closed on
Apr 24, 2000
Sold by
Harris Douglas D and Harris Sandra V
Bought by
Harris Douglas D and Harris Sandra
Purchase Details
Closed on
Jun 23, 1997
Sold by
Del Webb Communities Inc
Bought by
Harris Douglas D and Harris Sandra
Home Financials for this Owner
Home Financials are based on the most recent Mortgage that was taken out on this home.
Original Mortgage
$214,600
Interest Rate
5.5%
Create a Home Valuation Report for This Property
The Home Valuation Report is an in-depth analysis detailing your home's value as well as a comparison with similar homes in the area
Home Values in the Area
Average Home Value in this Area
Purchase History
| Date | Buyer | Sale Price | Title Company |
|---|---|---|---|
| Yao Neng Ping | -- | None Available | |
| Yao Neng Ping | $599,900 | First American Title Co Of | |
| Harris Douglas D | -- | -- | |
| Harris Douglas D | $360,000 | First American Title Co |
Source: Public Records
Mortgage History
| Date | Status | Borrower | Loan Amount |
|---|---|---|---|
| Open | Yao Neng Ping | $480,000 | |
| Previous Owner | Harris Douglas D | $214,600 |
Source: Public Records
Tax History Compared to Growth
Tax History
| Year | Tax Paid | Tax Assessment Tax Assessment Total Assessment is a certain percentage of the fair market value that is determined by local assessors to be the total taxable value of land and additions on the property. | Land | Improvement |
|---|---|---|---|---|
| 2025 | $5,177 | $207,602 | $97,860 | $109,742 |
| 2024 | $5,027 | $207,602 | $97,860 | $109,742 |
| 2023 | $5,027 | $188,164 | $84,000 | $104,164 |
| 2022 | $4,881 | $170,402 | $75,250 | $95,152 |
| 2021 | $4,739 | $155,825 | $64,855 | $90,970 |
| 2020 | $4,598 | $155,215 | $64,855 | $90,360 |
| 2019 | $4,464 | $146,541 | $57,348 | $89,193 |
| 2018 | $4,334 | $137,099 | $50,995 | $86,104 |
| 2017 | $4,420 | $133,986 | $47,530 | $86,456 |
| 2016 | $4,103 | $127,189 | $40,565 | $86,624 |
| 2015 | $4,095 | $121,509 | $35,945 | $85,564 |
| 2014 | $3,976 | $116,803 | $33,058 | $83,745 |
Source: Public Records
Map
Nearby Homes
- 2601 Lotus Hill Dr
- 10013 Cresent Creek Dr
- 10036 Keysborough Dr
- 10001 Cresent Creek Dr
- 2505 Rocky Plains Dr
- 10009 Netherton Dr
- 9840 Kernville Dr
- 10144 Hunter Springs Dr
- 10025 Netherton Dr
- 2504 Youngdale Dr
- 2548 Tumble Brook Dr
- 2624 Spalding Dr
- 9817 Kernville Dr
- 2652 Youngdale Dr
- 2513 Dark Peak Dr
- 2725 Byron Dr
- 2801 Byron Dr
- 2509 Big Timber Dr
- 2712 Lotus Hill Dr
- 2320 Sunrise Meadows Dr
- 2529 High Range Dr Unit 35
- 2537 High Range Dr
- 10001 Hunter Springs Dr
- 2525 High Range Dr
- 2532 High Range Dr
- 2528 High Range Dr
- 10005 Hunter Springs Dr
- 2536 High Range Dr
- 2524 High Range Dr
- 2601 High Range Dr
- 10009 Hunter Springs Dr
- 10000 Hunter Springs Dr
- 2600 High Range Dr
- 2520 High Range Dr
- 10004 Hunter Springs Dr
- 2604 High Range Dr
- 10008 Hunter Springs Dr
- 10016 Button Willow Dr
- 10020 Button Willow Dr
- 10017 Hope Island Dr