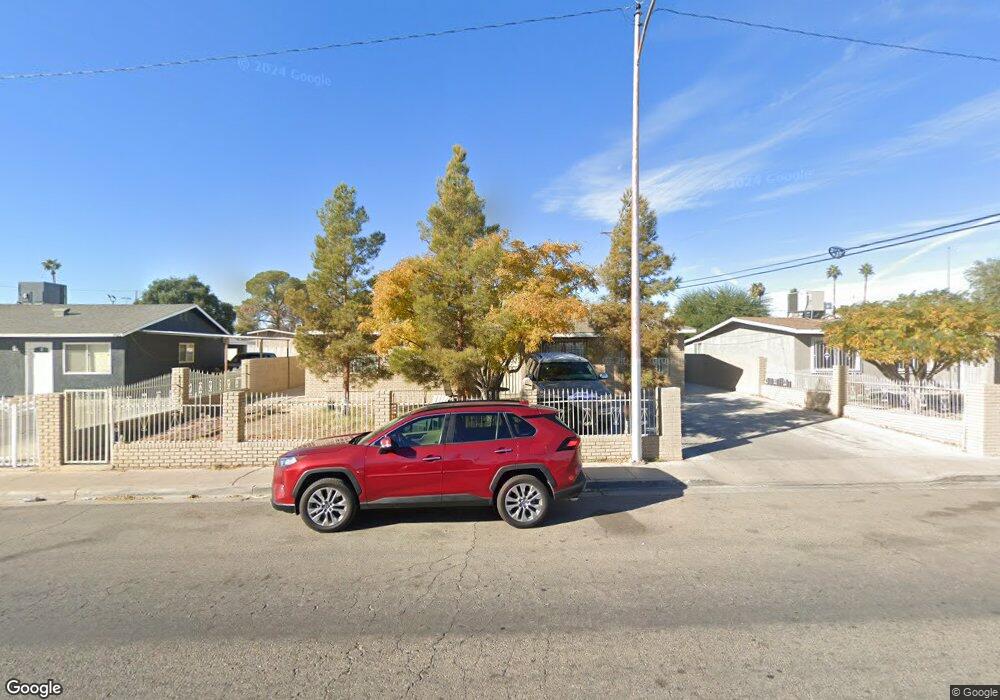
2533 N Bruce St North Las Vegas, NV 89030
Downtown North Las Vegas NeighborhoodEstimated Value: $309,157 - $384,000
4
Beds
1
Bath
2,307
Sq Ft
$151/Sq Ft
Est. Value
About This Home
This home is located at 2533 N Bruce St, North Las Vegas, NV 89030 and is currently estimated at $348,539, approximately $151 per square foot. 2533 N Bruce St is a home located in Clark County with nearby schools including Quannah Mccall Elementary School, Jim Bridger Middle School, and Canyon Springs High School And The Leadership And.
Ownership History
Date
Name
Owned For
Owner Type
Purchase Details
Closed on
Jul 11, 2022
Sold by
Unknown
Bought by
Chavez Osvaldo Fuentes
Current Estimated Value
Purchase Details
Closed on
May 6, 2016
Sold by
Fuentes Chavez Osvaldo and Fuentes Osvaldo
Bought by
Fuentes Osvaldo and Fuentes Jonathan
Purchase Details
Closed on
Jul 16, 1998
Sold by
Fuentes Olivia
Bought by
Chavez Osvaldo Fuentes
Home Financials for this Owner
Home Financials are based on the most recent Mortgage that was taken out on this home.
Original Mortgage
$92,090
Interest Rate
7%
Purchase Details
Closed on
Jun 24, 1998
Sold by
Watson Mary L
Bought by
Fuentes Chavez Osvaldo
Home Financials for this Owner
Home Financials are based on the most recent Mortgage that was taken out on this home.
Original Mortgage
$92,090
Interest Rate
7%
Create a Home Valuation Report for This Property
The Home Valuation Report is an in-depth analysis detailing your home's value as well as a comparison with similar homes in the area
Home Values in the Area
Average Home Value in this Area
Purchase History
| Date | Buyer | Sale Price | Title Company |
|---|---|---|---|
| Chavez Osvaldo Fuentes | -- | None Listed On Document | |
| Fuentes Osvaldo | -- | None Available | |
| Chavez Osvaldo Fuentes | -- | First American Title Co | |
| Fuentes Chavez Osvaldo | $93,000 | First American Title Co |
Source: Public Records
Mortgage History
| Date | Status | Borrower | Loan Amount |
|---|---|---|---|
| Previous Owner | Fuentes Chavez Osvaldo | $92,090 |
Source: Public Records
Tax History Compared to Growth
Tax History
| Year | Tax Paid | Tax Assessment Tax Assessment Total Assessment is a certain percentage of the fair market value that is determined by local assessors to be the total taxable value of land and additions on the property. | Land | Improvement |
|---|---|---|---|---|
| 2025 | $911 | $50,515 | $23,450 | $27,065 |
| 2024 | $885 | $50,515 | $23,450 | $27,065 |
| 2023 | $885 | $51,059 | $25,200 | $25,859 |
| 2022 | $859 | $46,180 | $21,700 | $24,480 |
| 2021 | $834 | $45,299 | $21,350 | $23,949 |
| 2020 | $807 | $44,065 | $19,600 | $24,465 |
| 2019 | $784 | $39,410 | $14,700 | $24,710 |
| 2018 | $761 | $36,452 | $12,250 | $24,202 |
| 2017 | $1,169 | $34,839 | $9,800 | $25,039 |
| 2016 | $722 | $31,567 | $5,250 | $26,317 |
| 2015 | $719 | $31,751 | $5,250 | $26,501 |
| 2014 | $698 | $26,787 | $3,850 | $22,937 |
Source: Public Records
Map
Nearby Homes
- 1400 Putnam Ave
- 1608 Putnam Ave
- 1117 Cold Harbor Dr
- 2525 Donna St Unit B
- 2525 Donna St Unit L
- 2533 Saint George St
- 2515 Donna St Unit C
- 2417 Saint George St
- 2426 N Salt Lake St
- 2424 N Salt Lake St
- 0 N Salt Lake St
- 1405 Oakwood Ave
- 700 E Nelson Ave Unit D
- 2532 Arrowhead St
- 2616 Spear St
- 2100 Dogwood Ave
- 820 Judson Ave
- 2519 Carroll St
- 2204 Dogwood Ave
- 0 Fairfax Unit 2664085
- 2529 N Bruce St
- 1212 Putnam Ave
- 1215 E Cartier Ave
- 2541 N Bruce St
- 2528 N Bruce St
- 1208 Putnam Ave
- 2536 N Bruce St
- 1209 E Cartier Ave
- 1304 Putnam Ave
- 1204 Putnam Ave
- 1305 E Cartier Ave
- 1205 E Cartier Ave
- 1308 Putnam Ave
- 1200 Putnam Ave
- 2601 N Bruce St
- 1301 Putnam Ave
- 1309 E Cartier Ave
- 1201 E Cartier Ave
- 2600 Stone River Place
- 1305 Putnam Ave