2533 Parrish St Unit n/a Henrico, VA 23231
Estimated Value: $249,000 - $280,000
3
Beds
3
Baths
1,847
Sq Ft
$145/Sq Ft
Est. Value
About This Home
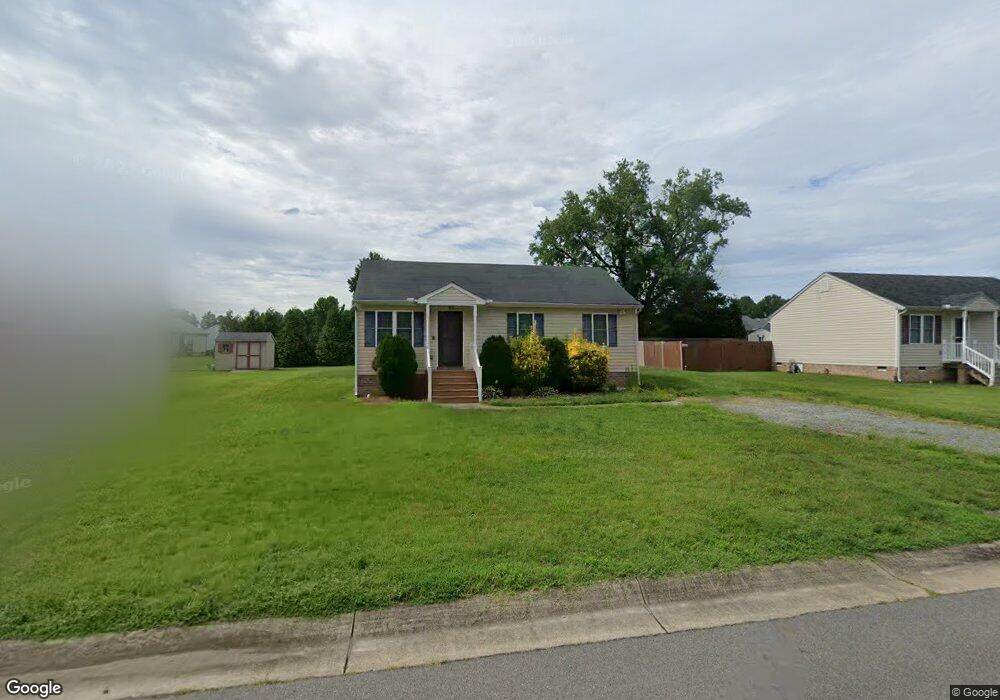
This home is located at 2533 Parrish St Unit n/a, Henrico, VA 23231 and is currently estimated at $267,885, approximately $145 per square foot. 2533 Parrish St Unit n/a is a home located in Henrico County with nearby schools including Montrose Elementary School, John Rolfe Middle School, and Varina High School.
Ownership History
Date
Name
Owned For
Owner Type
Purchase Details
Closed on
Jul 13, 2022
Sold by
Tarry Sharinna D
Bought by
Griffith Shayla C
Current Estimated Value
Home Financials for this Owner
Home Financials are based on the most recent Mortgage that was taken out on this home.
Original Mortgage
$194,000
Outstanding Balance
$184,569
Interest Rate
5.09%
Mortgage Type
New Conventional
Estimated Equity
$83,316
Purchase Details
Closed on
Nov 16, 2009
Sold by
Shurm Construction Inc
Bought by
Tarry Sharinna D
Home Financials for this Owner
Home Financials are based on the most recent Mortgage that was taken out on this home.
Original Mortgage
$147,233
Interest Rate
4.86%
Mortgage Type
FHA
Purchase Details
Closed on
Sep 11, 2009
Sold by
Sydney And Sydney Development
Bought by
Shurm Construction Inc
Create a Home Valuation Report for This Property
The Home Valuation Report is an in-depth analysis detailing your home's value as well as a comparison with similar homes in the area
Home Values in the Area
Average Home Value in this Area
Purchase History
| Date | Buyer | Sale Price | Title Company |
|---|---|---|---|
| Griffith Shayla C | $200,000 | Old Republic National Title | |
| Tarry Sharinna D | $149,950 | -- | |
| Shurm Construction Inc | $120,000 | -- |
Source: Public Records
Mortgage History
| Date | Status | Borrower | Loan Amount |
|---|---|---|---|
| Open | Griffith Shayla C | $194,000 | |
| Previous Owner | Tarry Sharinna D | $147,233 |
Source: Public Records
Tax History Compared to Growth
Tax History
| Year | Tax Paid | Tax Assessment Tax Assessment Total Assessment is a certain percentage of the fair market value that is determined by local assessors to be the total taxable value of land and additions on the property. | Land | Improvement |
|---|---|---|---|---|
| 2025 | $1,991 | $233,500 | $44,000 | $189,500 |
| 2024 | $1,991 | $225,200 | $42,000 | $183,200 |
| 2023 | $1,914 | $225,200 | $42,000 | $183,200 |
| 2022 | $1,413 | $166,200 | $40,000 | $126,200 |
| 2021 | $1,342 | $145,300 | $34,000 | $111,300 |
| 2020 | $1,264 | $145,300 | $34,000 | $111,300 |
| 2019 | $1,227 | $141,000 | $32,000 | $109,000 |
| 2018 | $1,140 | $131,000 | $45,000 | $86,000 |
| 2017 | $1,097 | $126,100 | $45,000 | $81,100 |
| 2016 | $996 | $114,500 | $45,000 | $69,500 |
| 2015 | $996 | $114,500 | $45,000 | $69,500 |
| 2014 | $996 | $114,500 | $45,000 | $69,500 |
Source: Public Records
Map
Nearby Homes
- 4409 Samara Dr
- 2715 Carlisle Ave
- 2509 Carlisle Ave
- 2501 Carlisle Ave
- 2804 Williamsburg Rd
- 2607 Williamsburg Rd
- 4619 Hillbrook Ave
- 2609 Tater Terrace
- 2317 Farrand Dr
- 2628 Butterbean Ct
- 2641 Butterbean Ct
- 2658 Biscuit Ct
- 2218 Bailey Dr
- 4606 Chipoax Ave
- 2239 Williamsburg Rd
- 3201 Chesham St
- 5110 Kemp St
- 5211 Montpelier St
- 3410 Dewsberry Ln
- 1910 Rawlings St
- 2533 Parrish St
- 2529 Parrish St
- 2529 Parrish St Unit N/A
- 2530 Parrish St
- 2537 Parrish St
- 2525 Parrish St
- 2525 Parrish St Unit 48
- 2511 Blackberry Patch Ct
- 2534 Parrish St
- 2526 Parrish St
- 2507 Blackberry Patch Ct
- 2538 Parrish St
- 2522 Parrish St
- 2541 Parrish St
- 4604 Raspberry Patch Ln
- 4601 Blackberry Patch Rd
- 2510 Blackberry Patch Ct
- 4608 Raspberry Patch Ln
- 2542 Parrish St
- 2501 Blackberry Patch Ct