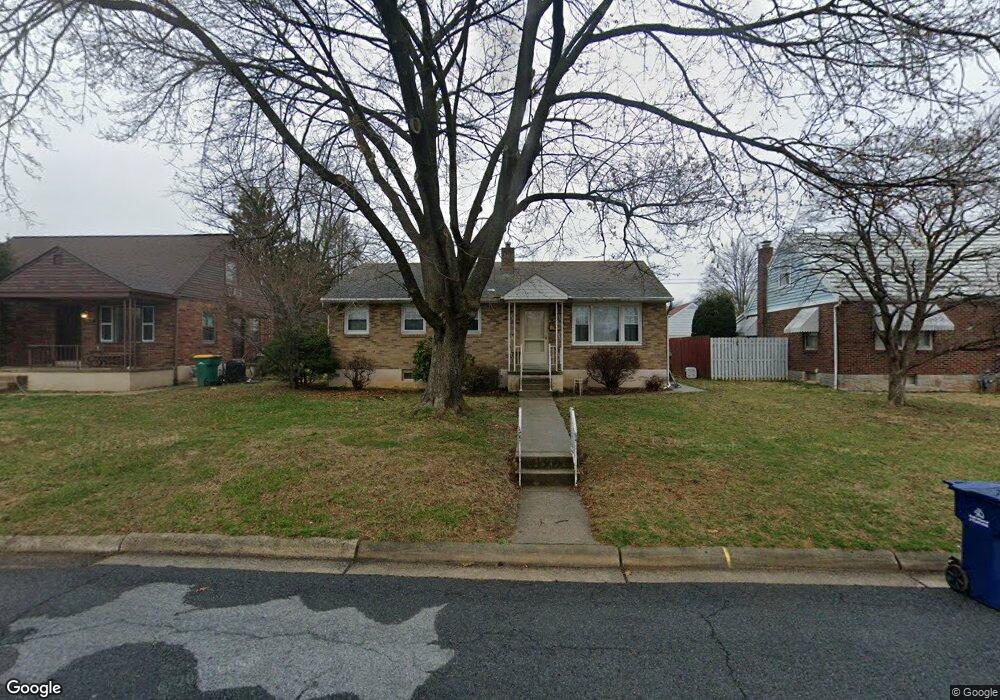
2533 Reading Blvd Reading, PA 19609
West Wyomissing NeighborhoodEstimated Value: $211,000 - $266,000
2
Beds
1
Bath
960
Sq Ft
$257/Sq Ft
Est. Value
About This Home
This home is located at 2533 Reading Blvd, Reading, PA 19609 and is currently estimated at $246,941, approximately $257 per square foot. 2533 Reading Blvd is a home located in Berks County with nearby schools including Spring Ridge Elementary School, Wilson Southern Middle School, and Wilson High School.
Ownership History
Date
Name
Owned For
Owner Type
Purchase Details
Closed on
Mar 17, 2023
Sold by
Mckeone Eileen Nora
Bought by
Chelius Mark Bennett
Current Estimated Value
Home Financials for this Owner
Home Financials are based on the most recent Mortgage that was taken out on this home.
Original Mortgage
$132,000
Outstanding Balance
$127,848
Interest Rate
6.12%
Mortgage Type
New Conventional
Estimated Equity
$119,093
Purchase Details
Closed on
Sep 26, 2003
Sold by
Mack Kevin B and Mack Natasha
Bought by
Mckeone Eileen N
Home Financials for this Owner
Home Financials are based on the most recent Mortgage that was taken out on this home.
Original Mortgage
$123,400
Interest Rate
6.01%
Mortgage Type
Purchase Money Mortgage
Create a Home Valuation Report for This Property
The Home Valuation Report is an in-depth analysis detailing your home's value as well as a comparison with similar homes in the area
Home Values in the Area
Average Home Value in this Area
Purchase History
| Date | Buyer | Sale Price | Title Company |
|---|---|---|---|
| Chelius Mark Bennett | $165,000 | Stewart Title | |
| Mckeone Eileen N | $129,900 | -- |
Source: Public Records
Mortgage History
| Date | Status | Borrower | Loan Amount |
|---|---|---|---|
| Open | Chelius Mark Bennett | $132,000 | |
| Previous Owner | Mckeone Eileen N | $123,400 |
Source: Public Records
Tax History Compared to Growth
Tax History
| Year | Tax Paid | Tax Assessment Tax Assessment Total Assessment is a certain percentage of the fair market value that is determined by local assessors to be the total taxable value of land and additions on the property. | Land | Improvement |
|---|---|---|---|---|
| 2025 | $1,721 | $87,600 | $33,100 | $54,500 |
| 2024 | $3,748 | $87,600 | $33,100 | $54,500 |
| 2023 | $3,571 | $87,600 | $33,100 | $54,500 |
| 2022 | $3,484 | $87,600 | $33,100 | $54,500 |
| 2021 | $3,361 | $87,600 | $33,100 | $54,500 |
| 2020 | $3,361 | $87,600 | $33,100 | $54,500 |
| 2019 | $3,265 | $87,600 | $33,100 | $54,500 |
| 2018 | $3,237 | $87,600 | $33,100 | $54,500 |
| 2017 | $3,183 | $87,600 | $33,100 | $54,500 |
| 2016 | $1,131 | $87,600 | $33,100 | $54,500 |
| 2015 | $1,131 | $87,600 | $33,100 | $54,500 |
| 2014 | $1,131 | $87,600 | $33,100 | $54,500 |
Source: Public Records
Map
Nearby Homes
- 2552 Garfield Ave
- 2525 Mckinley Ave
- 211 Halsey Ave
- 2419 Penn Ave
- 102 Intervilla Ave
- 608 W Wyomissing Blvd
- 429 W Wyomissing Blvd
- 3411 Penn Ave
- 3413 Penn Ave
- 2214 Mckinley Ave
- 3029 Grandview Blvd
- 2341 Highland St
- 2157 Girard Ave
- 2126 Lincoln Ave
- 2152 Cleveland Ave
- 1334 W Wyomissing Ct Unit Q
- 423 Woodside Ave
- 510 Dorchester Ave
- 118 Octagon Ave
- 510 Lenore Place
- 2537 Reading Blvd
- 2529 Reading Blvd
- 2525 Reading Blvd
- 2575 Reading Blvd
- 2548 Garfield Ave
- 2550 Garfield Ave
- 2546 Garfield Ave
- 2523 Reading Blvd
- 2544 Garfield Ave
- 2538 Reading Blvd
- 2542 Reading Blvd
- 2542 Garfield Ave
- 2536 Reading Blvd
- 2544 Reading Blvd
- 2521 Reading Blvd
- 2538 Garfield Ave
- 2601 Reading Blvd
- 2534 Reading Blvd
- 2536 Garfield Ave
- 2600 Garfield Ave