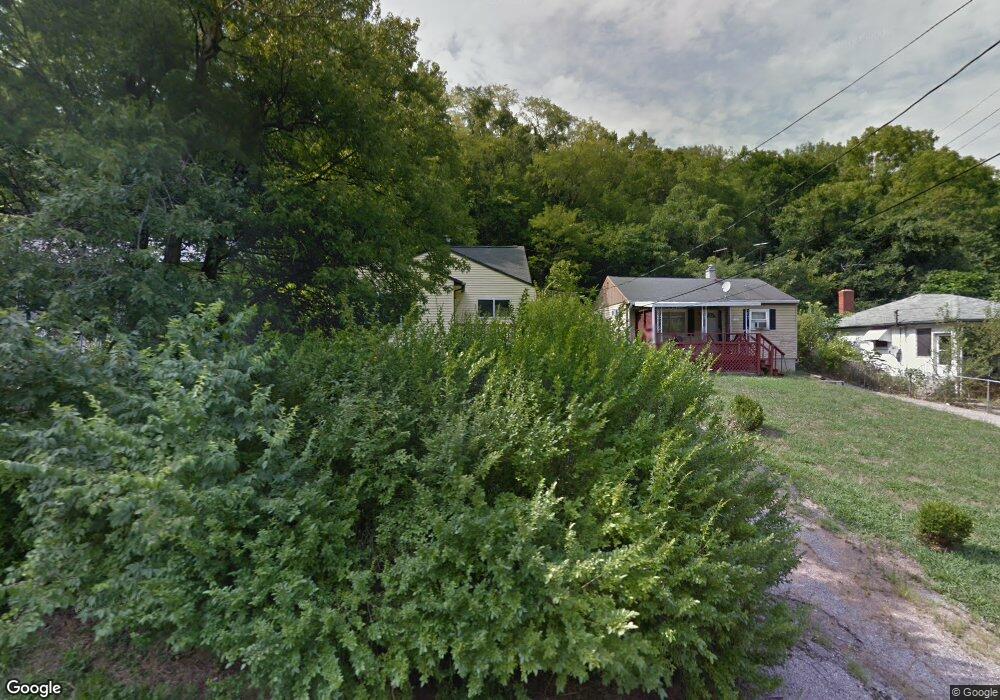
2533 Saint Leo Place Cincinnati, OH 45225
North Fairmount NeighborhoodEstimated Value: $55,000 - $173,000
3
Beds
1
Bath
1,242
Sq Ft
$89/Sq Ft
Est. Value
About This Home
This home is located at 2533 Saint Leo Place, Cincinnati, OH 45225 and is currently estimated at $109,979, approximately $88 per square foot. 2533 Saint Leo Place is a home located in Hamilton County with nearby schools including Ethel M. Taylor Academy, Robert A. Taft Information Technology High School, and Western Hills High School.
Ownership History
Date
Name
Owned For
Owner Type
Purchase Details
Closed on
May 25, 2012
Sold by
Stonecrest Income & Opportunity Fund I L
Bought by
Chambers Davetta
Current Estimated Value
Purchase Details
Closed on
Aug 22, 2011
Sold by
Chambers Davetta
Bought by
Robinson Charles and Chambers Davetta
Purchase Details
Closed on
Oct 6, 2009
Sold by
Nationstar Mortgage Llc
Bought by
Stonecrest Income & Opportunity Fund 1 L
Purchase Details
Closed on
May 26, 2009
Sold by
Vanmauldin Lee
Bought by
Nationstar Mortgage Llc and Centex Home Equity Company Llc
Purchase Details
Closed on
Dec 22, 1999
Sold by
Hodge Gerda L and Hodge Diane
Bought by
Vanvanmauldin Lee Van
Home Financials for this Owner
Home Financials are based on the most recent Mortgage that was taken out on this home.
Original Mortgage
$55,600
Interest Rate
11.87%
Create a Home Valuation Report for This Property
The Home Valuation Report is an in-depth analysis detailing your home's value as well as a comparison with similar homes in the area
Home Values in the Area
Average Home Value in this Area
Purchase History
| Date | Buyer | Sale Price | Title Company |
|---|---|---|---|
| Chambers Davetta | $5,000 | None Available | |
| Robinson Charles | -- | None Available | |
| Stonecrest Income & Opportunity Fund 1 L | -- | None Available | |
| Nationstar Mortgage Llc | $34,000 | Attorney | |
| Vanvanmauldin Lee Van | $70,000 | -- |
Source: Public Records
Mortgage History
| Date | Status | Borrower | Loan Amount |
|---|---|---|---|
| Previous Owner | Vanvanmauldin Lee Van | $55,600 | |
| Closed | Vanvanmauldin Lee Van | $6,950 |
Source: Public Records
Tax History Compared to Growth
Tax History
| Year | Tax Paid | Tax Assessment Tax Assessment Total Assessment is a certain percentage of the fair market value that is determined by local assessors to be the total taxable value of land and additions on the property. | Land | Improvement |
|---|---|---|---|---|
| 2024 | $942 | $15,569 | $2,321 | $13,248 |
| 2023 | $963 | $15,569 | $2,321 | $13,248 |
| 2022 | $934 | $13,538 | $2,331 | $11,207 |
| 2021 | $895 | $13,538 | $2,331 | $11,207 |
| 2020 | $921 | $13,538 | $2,331 | $11,207 |
| 2019 | $916 | $12,307 | $2,118 | $10,189 |
| 2018 | $917 | $12,307 | $2,118 | $10,189 |
| 2017 | $871 | $12,307 | $2,118 | $10,189 |
| 2016 | $196 | $2,639 | $2,317 | $322 |
| 2015 | $178 | $2,639 | $2,317 | $322 |
| 2014 | $179 | $2,639 | $2,317 | $322 |
| 2013 | $188 | $2,612 | $2,293 | $319 |
Source: Public Records
Map
Nearby Homes
- 1859 Baltimore Ave
- 1854 Carll St
- 1871 Fairmount Ave
- 1808 Carll St
- 1854 Knox St
- 2521 Seegar Ave
- 1797 Denham St
- 1977 Harrison Ave
- 2456 Saturn St
- 1770 Carll St
- 2455 Saturn St
- 2568 Trevor Place
- 2009 Harrison Ave
- 2453 Saturn St
- 1756 Carll St
- 1965 Baltimore Ave
- 2473 Everglade Place
- 2060 Bickel Ave
- 1708 Harrison Ave
- 1724 Harrison Ave
- 2535 Saint Leo Place
- 2527 Saint Leo Place
- 2539 Saint Leo Place
- 2521 Saint Leo Place
- 2532 Saint Leo Place
- 2545 Saint Leo Place
- Lot 6 Saint Leo Place
- Lot 4 Saint Leo Place
- Lot 5 Saint Leo Place
- Lot 13 Saint Leo Place
- Lot 7 Saint Leo Place
- Lot 3 Saint Leo Place
- 2524 Saint Leo Place
- 2540 Saint Leo Place
- 2551 Saint Leo Place
- 2542 Saint Leo Place
- 2518 Saint Leo Place
- 2530 Saint Leo Place
- 2541 Norton St
- 2544 Saint Leo Place