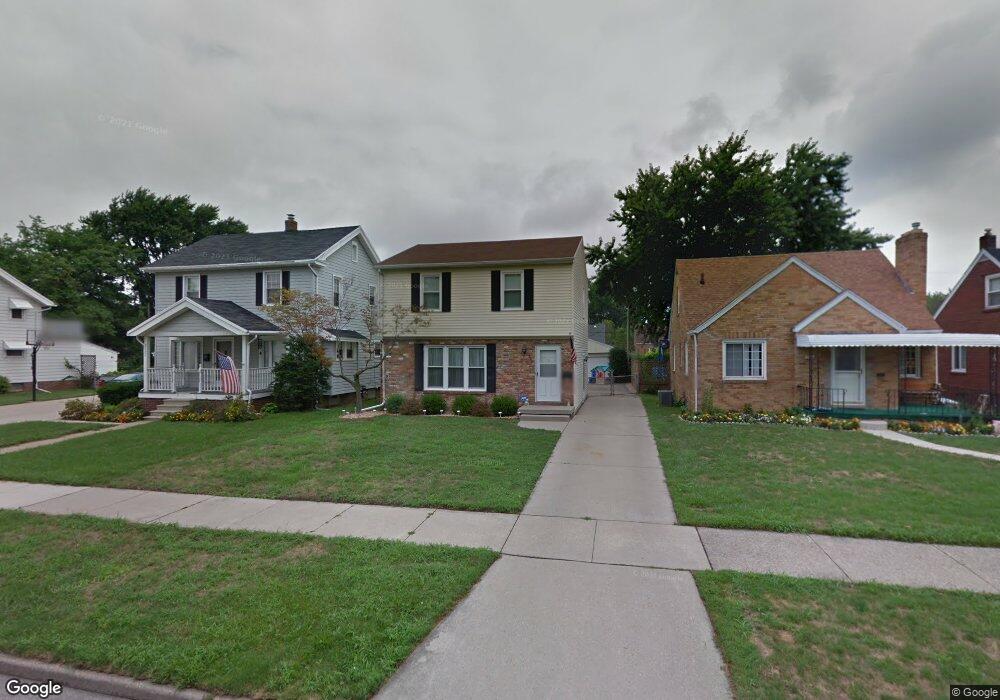
2533 Taft Ave Oregon, OH 43616
Estimated Value: $178,000 - $208,000
3
Beds
2
Baths
1,404
Sq Ft
$132/Sq Ft
Est. Value
About This Home
This home is located at 2533 Taft Ave, Oregon, OH 43616 and is currently estimated at $185,815, approximately $132 per square foot. 2533 Taft Ave is a home located in Lucas County with nearby schools including Kateri Catholic Academy and St. Kateri Catholic Schools.
Ownership History
Date
Name
Owned For
Owner Type
Purchase Details
Closed on
May 25, 2007
Sold by
Walker Eleanore F and Hartman Joseph T
Bought by
Schultz Lee J and Schultz Christine L
Current Estimated Value
Home Financials for this Owner
Home Financials are based on the most recent Mortgage that was taken out on this home.
Original Mortgage
$137,000
Outstanding Balance
$82,285
Interest Rate
6.21%
Mortgage Type
Purchase Money Mortgage
Estimated Equity
$103,530
Purchase Details
Closed on
Sep 1, 2000
Sold by
Summers Alan J and Summers Cheryl S
Bought by
Campbell Alan D and Campbell Heather M
Home Financials for this Owner
Home Financials are based on the most recent Mortgage that was taken out on this home.
Original Mortgage
$100,500
Interest Rate
8.05%
Mortgage Type
Purchase Money Mortgage
Purchase Details
Closed on
Mar 4, 1991
Sold by
Sutphin Donald L
Create a Home Valuation Report for This Property
The Home Valuation Report is an in-depth analysis detailing your home's value as well as a comparison with similar homes in the area
Home Values in the Area
Average Home Value in this Area
Purchase History
| Date | Buyer | Sale Price | Title Company |
|---|---|---|---|
| Schultz Lee J | $137,000 | Louisville Title Agency For | |
| Walker Eleanor F | -- | Louisville Title Agency For | |
| Campbell Alan D | $115,500 | -- | |
| -- | $73,500 | -- |
Source: Public Records
Mortgage History
| Date | Status | Borrower | Loan Amount |
|---|---|---|---|
| Open | Walker Eleanor F | $137,000 | |
| Closed | Schultz Lee J | $137,000 | |
| Previous Owner | Campbell Alan D | $100,500 |
Source: Public Records
Tax History
| Year | Tax Paid | Tax Assessment Tax Assessment Total Assessment is a certain percentage of the fair market value that is determined by local assessors to be the total taxable value of land and additions on the property. | Land | Improvement |
|---|---|---|---|---|
| 2025 | -- | $44,240 | $6,055 | $38,185 |
| 2024 | $1,074 | $44,240 | $6,055 | $38,185 |
| 2023 | $2,634 | $46,305 | $4,095 | $42,210 |
| 2022 | $2,653 | $46,305 | $4,095 | $42,210 |
| 2021 | $2,674 | $46,305 | $4,095 | $42,210 |
| 2020 | $2,494 | $38,360 | $3,360 | $35,000 |
| 2019 | $2,424 | $38,360 | $3,360 | $35,000 |
| 2018 | $2,336 | $38,360 | $3,360 | $35,000 |
| 2017 | $2,301 | $34,125 | $4,655 | $29,470 |
| 2016 | $2,272 | $97,500 | $13,300 | $84,200 |
| 2015 | $2,257 | $97,500 | $13,300 | $84,200 |
| 2014 | $2,093 | $33,430 | $4,550 | $28,880 |
| 2013 | $2,093 | $33,430 | $4,550 | $28,880 |
Source: Public Records
Map
Nearby Homes
- 2544 Cawdor Rd
- 2432 Rochester Place
- 230 Ritter Ave
- 2011 Oakdale Ave
- 3517 Goodrich Ave
- 1466 Sunshine St
- 1464 Sunshine St
- 2249 Pickle Rd
- 1043 Lakeside Ln
- 1134 Laura Ln
- 1957 Carvelle Dr
- 1512 Vinal St
- 1531 Freedom St
- 3515 Brown Rd
- 1508 Albert St
- 1532 Liberty St
- 1413 Ironwood Ave
- 199 E Bridge Rd
- 1219 Crystal St
- 1401 Liberty St
Your Personal Tour Guide
Ask me questions while you tour the home.