2534 10th Ave Oakland, CA 94606
Bella Vista NeighborhoodEstimated Value: $677,000 - $1,345,037
About This Home
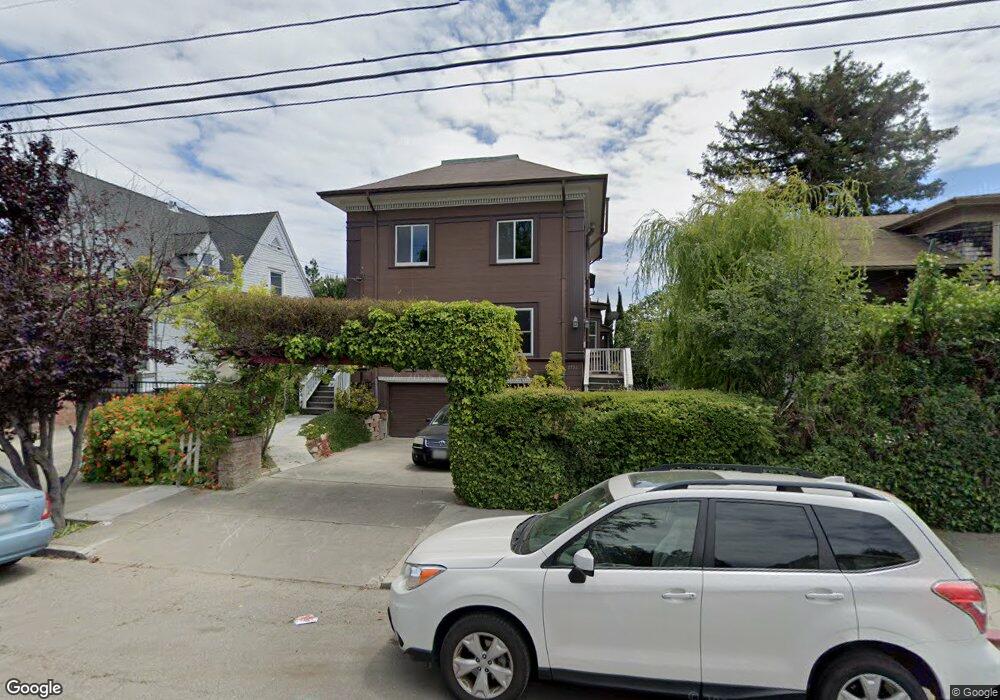
This home is located at 2534 10th Ave, Oakland, CA 94606 and is currently estimated at $1,095,259, approximately $493 per square foot. 2534 10th Ave is a home located in Alameda County with nearby schools including Bella Vista Elementary School, Edna Brewer Middle School, and Oakland High School.
Ownership History
We collect this data history from publicly available records. To have your information removed, we recommend requesting removal directly through your county’s website.
Purchase Details
Home Financials for this Owner
Home Financials are based on the most recent Mortgage that was taken out on this home.Purchase Details
Purchase Details
Home Financials for this Owner
Home Financials are based on the most recent Mortgage that was taken out on this home.Purchase Details
Home Financials for this Owner
Home Financials are based on the most recent Mortgage that was taken out on this home.Purchase Details
Home Financials for this Owner
Home Financials are based on the most recent Mortgage that was taken out on this home.Purchase Details
Home Financials for this Owner
Home Financials are based on the most recent Mortgage that was taken out on this home.Purchase Details
Home Financials for this Owner
Home Financials are based on the most recent Mortgage that was taken out on this home.Purchase Details
Home Financials for this Owner
Home Financials are based on the most recent Mortgage that was taken out on this home.Purchase Details
Home Financials for this Owner
Home Financials are based on the most recent Mortgage that was taken out on this home.Purchase Details
Home Financials for this Owner
Home Financials are based on the most recent Mortgage that was taken out on this home.Purchase Details
Home Financials for this Owner
Home Financials are based on the most recent Mortgage that was taken out on this home.Home Values in the Area
Average Home Value in this Area
Purchase History
We collect this data history from publicly available records. To have your information removed, we recommend requesting removal directly through your county’s website.
| Date | Buyer | Sale Price | Title Company |
|---|---|---|---|
| $1,270,000 | Chicago Title Company | ||
| -- | None Available | ||
| $100,000 | Old Republic Title Company | ||
| -- | Old Republic Title Company | ||
| -- | Old Republic Title Company | ||
| $600,000 | Old Republic Title Company | ||
| $234,900 | None Available | ||
| -- | Old Republic Title Company | ||
| $830,000 | Old Republic Title Company | ||
| -- | Fidelity National Title Co | ||
| -- | Fidelity National Title Co | ||
| $203,000 | Nortwestern Title Company | ||
| -- | Nortwestern Title Company |
Mortgage History
We collect this data history from publicly available records. To have your information removed, we recommend requesting removal directly through your county’s website.
| Date | Status | Borrower | Loan Amount |
|---|---|---|---|
| Open | $600,000 | ||
| Previous Owner | $506,000 | ||
| Previous Owner | $530,515 | ||
| Previous Owner | $542,327 | ||
| Previous Owner | $171,200 | ||
| Previous Owner | $650,000 | ||
| Previous Owner | $520,000 | ||
| Previous Owner | $235,000 | ||
| Previous Owner | $192,850 |
Tax History
We collect this data history from publicly available records. To have your information removed, we recommend requesting removal directly through your county’s website.
| Year | Tax Paid | Tax Assessment Tax Assessment Total Assessment is a certain percentage of the fair market value that is determined by local assessors to be the total taxable value of land and additions on the property. | Land | Improvement |
|---|---|---|---|---|
| 2025 | $19,423 | $1,374,673 | $412,402 | $962,271 |
| 2024 | $19,423 | $1,347,723 | $404,317 | $943,406 |
| 2023 | $20,493 | $1,321,307 | $396,392 | $924,915 |
| 2022 | $19,976 | $1,295,400 | $388,620 | $906,780 |
| 2021 | $13,185 | $829,200 | $250,860 | $585,340 |
| 2020 | $13,038 | $827,630 | $248,289 | $579,341 |
| 2019 | $12,549 | $811,404 | $243,421 | $567,983 |
| 2018 | $12,283 | $795,500 | $238,650 | $556,850 |
| 2017 | $11,809 | $779,903 | $233,971 | $545,932 |
| 2016 | $10,072 | $654,227 | $196,268 | $457,959 |
| 2015 | $10,019 | $644,405 | $193,321 | $451,084 |
| 2014 | $10,215 | $631,787 | $189,536 | $442,251 |
Map
- 2445 10th Ave
- 2605 9th Ave
- 905 E 24th St
- 2301 12th Ave
- 1328 E 25th St
- 1140 E 22nd St
- 1066 Bayview Ave
- 2226 13th Ave
- 710 E 22nd St Unit 303
- 710 E 22nd St Unit 203
- 1364 E 27th St
- 3206 Park Blvd
- 33 Home Place E
- 1141 E 33rd St
- 2821 Vallecito Place
- 2141 14th Ave
- 3214 13th Ave
- 1112 E 33rd St
- 2709 Vallecito Place
- 1000 E 33rd St
Ask me questions while you tour the home.