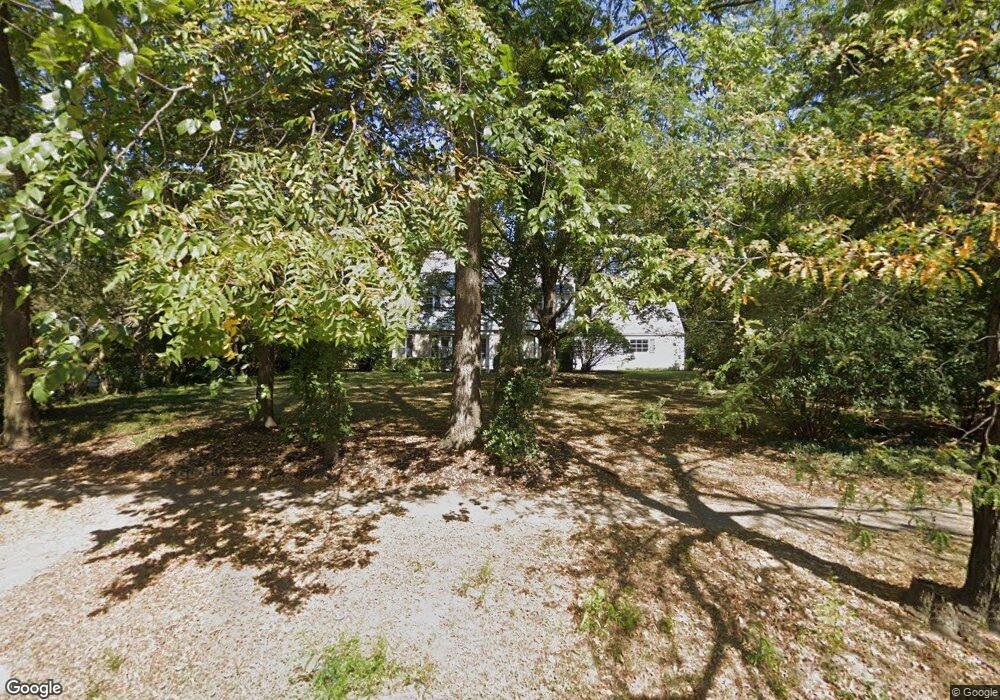
2534 E Broad St Columbus, OH 43209
Estimated Value: $771,000 - $945,000
4
Beds
3
Baths
2,580
Sq Ft
$326/Sq Ft
Est. Value
About This Home
This home is located at 2534 E Broad St, Columbus, OH 43209 and is currently estimated at $840,300, approximately $325 per square foot. 2534 E Broad St is a home located in Franklin County with nearby schools including Maryland Elementary School, Bexley Middle School, and Bexley High School.
Ownership History
Date
Name
Owned For
Owner Type
Purchase Details
Closed on
Jul 2, 2003
Sold by
Jones Williard Cathryn and Williard Stephen G
Bought by
Klatt Andrew J and Klatt Courtney L
Current Estimated Value
Home Financials for this Owner
Home Financials are based on the most recent Mortgage that was taken out on this home.
Original Mortgage
$280,000
Outstanding Balance
$115,881
Interest Rate
5.37%
Mortgage Type
Purchase Money Mortgage
Estimated Equity
$724,419
Purchase Details
Closed on
Sep 28, 2001
Sold by
Karmia Jodi Z
Bought by
Jones Cathryn E
Home Financials for this Owner
Home Financials are based on the most recent Mortgage that was taken out on this home.
Original Mortgage
$110,000
Interest Rate
6.99%
Purchase Details
Closed on
Jun 2, 1995
Sold by
Nutis Ira B
Bought by
Jodi Karmia
Home Financials for this Owner
Home Financials are based on the most recent Mortgage that was taken out on this home.
Original Mortgage
$63,000
Interest Rate
8.26%
Mortgage Type
New Conventional
Purchase Details
Closed on
May 1, 1985
Create a Home Valuation Report for This Property
The Home Valuation Report is an in-depth analysis detailing your home's value as well as a comparison with similar homes in the area
Home Values in the Area
Average Home Value in this Area
Purchase History
| Date | Buyer | Sale Price | Title Company |
|---|---|---|---|
| Klatt Andrew J | $350,000 | Benchmark Title Agency Inc | |
| Jones Cathryn E | $270,000 | Hummel Title Agency Inc | |
| Jodi Karmia | $225,000 | -- | |
| -- | $165,000 | -- |
Source: Public Records
Mortgage History
| Date | Status | Borrower | Loan Amount |
|---|---|---|---|
| Open | Klatt Andrew J | $280,000 | |
| Closed | Jones Cathryn E | $110,000 | |
| Previous Owner | Jodi Karmia | $63,000 | |
| Closed | Jones Cathryn E | $25,000 |
Source: Public Records
Tax History
| Year | Tax Paid | Tax Assessment Tax Assessment Total Assessment is a certain percentage of the fair market value that is determined by local assessors to be the total taxable value of land and additions on the property. | Land | Improvement |
|---|---|---|---|---|
| 2025 | $13,776 | $248,080 | $131,250 | $116,830 |
| 2024 | $13,776 | $248,080 | $131,250 | $116,830 |
| 2023 | $12,386 | $248,080 | $131,250 | $116,830 |
| 2022 | $13,577 | $218,400 | $91,350 | $127,050 |
| 2021 | $13,588 | $218,400 | $91,350 | $127,050 |
| 2020 | $13,468 | $218,400 | $91,350 | $127,050 |
| 2019 | $12,758 | $182,010 | $76,130 | $105,880 |
| 2018 | $11,142 | $182,010 | $76,130 | $105,880 |
| 2017 | $11,612 | $202,870 | $76,130 | $126,740 |
| 2016 | $11,167 | $171,680 | $71,750 | $99,930 |
| 2015 | $11,200 | $171,680 | $71,750 | $99,930 |
| 2014 | $10,735 | $163,630 | $71,750 | $91,880 |
| 2013 | $5,073 | $148,750 | $65,240 | $83,510 |
Source: Public Records
Map
Nearby Homes
- 2465 E Broad St
- 52 N Ardmore Rd
- 112 S Cassady Ave
- 2731 E Broad St
- 125 S Stanwood Rd
- 193 Stanbery Ave
- 275 Ashbourne Place
- 243 N Stanwood Rd
- 2417 Fair Ave
- 386 Northview Dr
- 161 N Gould Rd
- 57 Preston Rd
- 336 S Columbia Ave
- 205 N Gould Rd
- 2728 Brentwood Rd
- 2425 Bryden Rd
- 488 Stanbery Ave
- 2729 Bexley Park Rd
- 2448 Sherwood Rd
- 2424 Sherwood Rd
- 2520 E Broad St
- 2556 E Broad St
- 40 Ashbourne Rd
- 36 Ashbourne Rd
- 2500 E Broad St
- 50 Ashbourne Rd
- 2529 E Broad St
- 36 N Cassady Ave
- 30 Ashbourne Rd
- 2521 E Broad St
- 2551 E Broad St
- 2557 E Broad St
- 2503 E Broad St
- 46 N Cassady Ave
- 46 N Cassady Ave
- 2561 E Broad St
- 2575 E Broad St
- 66 Ashbourne Rd
- 23 S Cassady Ave
- 56 N Cassady Ave
Your Personal Tour Guide
Ask me questions while you tour the home.