2534 Glenshire Cir Uniontown, OH 44685
Estimated Value: $273,000 - $299,552
3
Beds
3
Baths
1,792
Sq Ft
$161/Sq Ft
Est. Value
About This Home
This home is located at 2534 Glenshire Cir, Uniontown, OH 44685 and is currently estimated at $288,388, approximately $160 per square foot. 2534 Glenshire Cir is a home located in Summit County with nearby schools including Greenwood Elementary School, Green Primary School, and Green Intermediate Elementary School.
Ownership History
Date
Name
Owned For
Owner Type
Purchase Details
Closed on
Mar 31, 2020
Sold by
Sine Robert W
Bought by
Sine Patricia M
Current Estimated Value
Purchase Details
Closed on
Mar 24, 2020
Sold by
Sine Robert W
Bought by
Sine Patricia M
Purchase Details
Closed on
Aug 30, 2019
Sold by
Manning Jeffrey J
Bought by
Sine Robert W and Sine Patricia M
Purchase Details
Closed on
Jul 11, 2016
Sold by
Manning James A
Bought by
Manning James A
Purchase Details
Closed on
May 10, 2007
Sold by
Estate Of Patricia A Manning
Bought by
Manning James A
Purchase Details
Closed on
Sep 6, 1995
Sold by
Mckinley Dev Co
Bought by
Manning James A and Manning Patricia A
Home Financials for this Owner
Home Financials are based on the most recent Mortgage that was taken out on this home.
Original Mortgage
$58,600
Interest Rate
6.88%
Mortgage Type
New Conventional
Create a Home Valuation Report for This Property
The Home Valuation Report is an in-depth analysis detailing your home's value as well as a comparison with similar homes in the area
Home Values in the Area
Average Home Value in this Area
Purchase History
| Date | Buyer | Sale Price | Title Company |
|---|---|---|---|
| Sine Patricia M | -- | -- | |
| Sine Patricia M | -- | -- | |
| Sine Robert W | $190,000 | None Available | |
| Manning James A | -- | None Available | |
| Manning James A | -- | None Available | |
| Manning James A | $158,580 | -- |
Source: Public Records
Mortgage History
| Date | Status | Borrower | Loan Amount |
|---|---|---|---|
| Previous Owner | Manning James A | $58,600 |
Source: Public Records
Tax History Compared to Growth
Tax History
| Year | Tax Paid | Tax Assessment Tax Assessment Total Assessment is a certain percentage of the fair market value that is determined by local assessors to be the total taxable value of land and additions on the property. | Land | Improvement |
|---|---|---|---|---|
| 2025 | $3,764 | $86,783 | $8,166 | $78,617 |
| 2024 | $3,764 | $86,783 | $8,166 | $78,617 |
| 2023 | $3,764 | $86,783 | $8,166 | $78,617 |
| 2022 | $3,234 | $68,335 | $6,430 | $61,905 |
| 2021 | $3,039 | $68,335 | $6,430 | $61,905 |
| 2020 | $2,983 | $68,340 | $6,430 | $61,910 |
| 2019 | $3,407 | $64,150 | $6,430 | $57,720 |
| 2018 | $3,480 | $64,150 | $6,920 | $57,230 |
| 2017 | $3,350 | $64,150 | $6,920 | $57,230 |
| 2016 | $3,265 | $57,910 | $6,920 | $50,990 |
| 2015 | $3,350 | $57,910 | $6,920 | $50,990 |
| 2014 | $3,329 | $57,910 | $6,920 | $50,990 |
| 2013 | $3,393 | $58,690 | $6,920 | $51,770 |
Source: Public Records
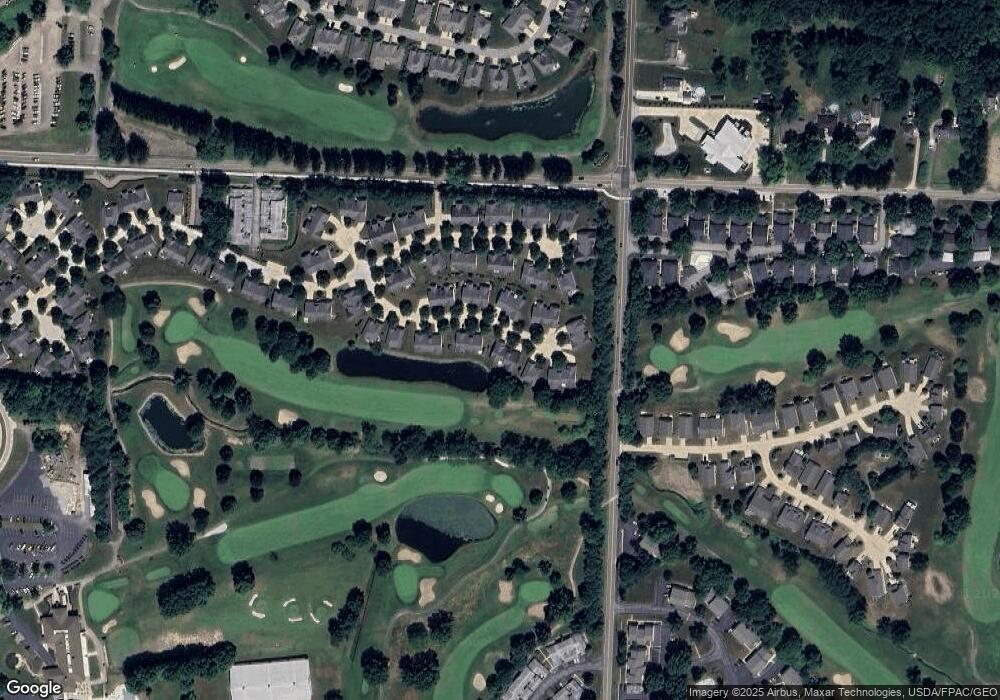
Map
Nearby Homes
- 2518 Glenshire Cir Unit 36A
- 3609 Glenshire Cir Unit 55B
- 3541 Elmhurst Cir
- 3598 Elmhurst Cir
- 2511 Royal County Down
- 3534 Chanticleer Ct
- 2535 Royal County Down Unit B
- 2500 Marlborough Dr
- 2245 Glenross Dr
- 2154 Prestwick Dr
- Northwood Plan at Spring Hill - Spring Hill Villas
- Kenai Plan at Spring Hill - Spring Hill Villas
- Bradbern Plan at Spring Hill - Spring Hill Villas
- Sarasota Plan at Spring Hill - Spring Hill Villas
- Holston Plan at Spring Hill - Spring Hill Villas
- Chester Plan at Spring Hill - Spring Hill Villas
- 4009 Troon Dr
- 2189 E Park Dr
- 3212 Deborah Ct
- 3523 Parfoure Blvd
- 2540 Glenshire Cir Unit 34B
- 2528 Glenshire Cir Unit 35
- 2548 Glenshire Cir
- 2543 Glenshire Cir
- 2558 Glenshire Cir
- 2537 Glenshire Cir
- 2551 Glenshire Cir
- 2529 Glenshire Cir Unit 38B
- 2512 Glenshire Cir
- 2559 Glenshire Cir
- 2559 Glenshire Cir Unit 40B
- 2510 Glenshire Cir
- 2519 Glenshire Cir
- 2564 Glenshire Cir
- 2564 Glenshire Cir Unit 31a
- 2567 Glenshire Cir
- 2556 Cardington Green
- 2550 Cardington Green Unit 46A
- 2575 Glenshire Cir Unit 41B
- 2540 Cardington Green Unit 47