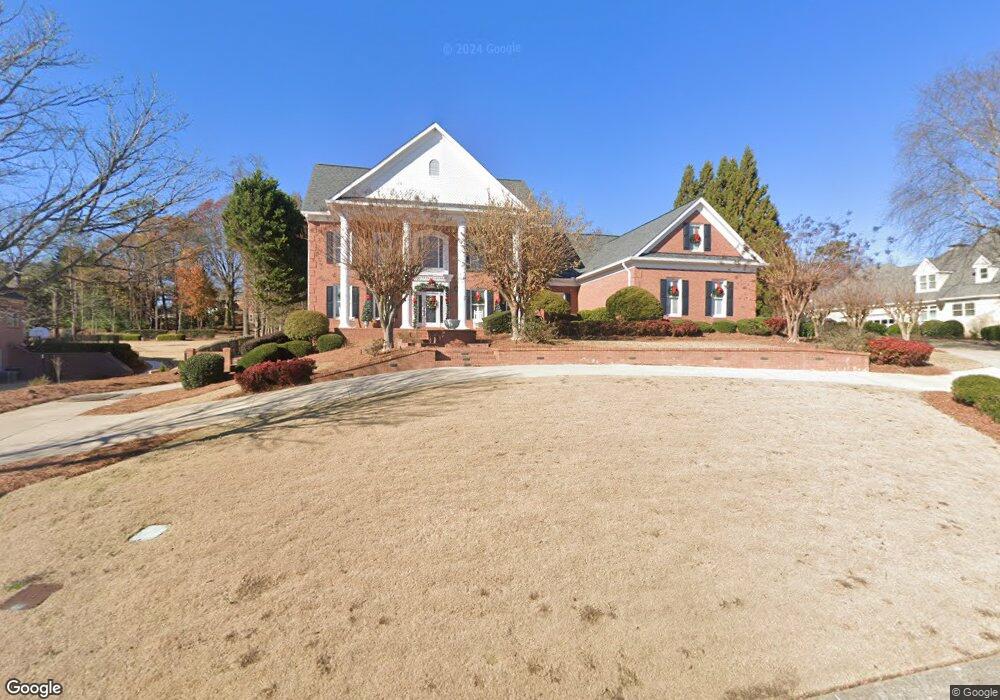
2534 Ivy Plantation Dr Buford, GA 30519
Estimated Value: $905,000 - $926,127
5
Beds
7
Baths
6,300
Sq Ft
$145/Sq Ft
Est. Value
About This Home
This home is located at 2534 Ivy Plantation Dr, Buford, GA 30519 and is currently estimated at $913,282, approximately $144 per square foot. 2534 Ivy Plantation Dr is a home located in Gwinnett County with nearby schools including Patrick Elementary School, Glenn C. Jones Middle School, and Oak Hill Classical School.
Ownership History
Date
Name
Owned For
Owner Type
Purchase Details
Closed on
Oct 31, 2024
Sold by
Cochran Edwin W
Bought by
Ebc2 Llc
Current Estimated Value
Home Financials for this Owner
Home Financials are based on the most recent Mortgage that was taken out on this home.
Original Mortgage
$675,000
Outstanding Balance
$668,280
Interest Rate
6.12%
Mortgage Type
New Conventional
Estimated Equity
$245,002
Purchase Details
Closed on
Jun 14, 2016
Sold by
Allen Donna Blount
Bought by
Holman Debora Blount
Purchase Details
Closed on
Apr 10, 2007
Sold by
Blount Gay C
Bought by
Blount Wendell P
Purchase Details
Closed on
Apr 30, 2002
Sold by
Varnson Alan
Bought by
Blount Gay C
Purchase Details
Closed on
Apr 24, 1998
Sold by
Pruitt Ruth W
Bought by
Varnson Alan
Home Financials for this Owner
Home Financials are based on the most recent Mortgage that was taken out on this home.
Original Mortgage
$359,550
Interest Rate
9.62%
Mortgage Type
New Conventional
Create a Home Valuation Report for This Property
The Home Valuation Report is an in-depth analysis detailing your home's value as well as a comparison with similar homes in the area
Home Values in the Area
Average Home Value in this Area
Purchase History
| Date | Buyer | Sale Price | Title Company |
|---|---|---|---|
| Ebc2 Llc | -- | -- | |
| Cochran Edwin W | $900,000 | -- | |
| Holman Debora Blount | $220,000 | -- | |
| Blount Wendell P | -- | -- | |
| Blount Gay C | $535,000 | -- | |
| Varnson Alan | $399,500 | -- |
Source: Public Records
Mortgage History
| Date | Status | Borrower | Loan Amount |
|---|---|---|---|
| Open | Cochran Edwin W | $675,000 | |
| Previous Owner | Varnson Alan | $359,550 |
Source: Public Records
Tax History Compared to Growth
Tax History
| Year | Tax Paid | Tax Assessment Tax Assessment Total Assessment is a certain percentage of the fair market value that is determined by local assessors to be the total taxable value of land and additions on the property. | Land | Improvement |
|---|---|---|---|---|
| 2024 | $2,887 | $267,760 | $52,800 | $214,960 |
| 2023 | $2,887 | $267,760 | $52,800 | $214,960 |
| 2022 | $8,360 | $267,760 | $52,800 | $214,960 |
| 2021 | $7,125 | $202,560 | $41,440 | $161,120 |
| 2020 | $7,173 | $202,560 | $41,440 | $161,120 |
| 2019 | $6,764 | $194,080 | $34,000 | $160,080 |
| 2018 | $6,781 | $194,080 | $34,000 | $160,080 |
| 2016 | $2,603 | $164,760 | $32,400 | $132,360 |
| 2015 | $2,660 | $164,760 | $32,400 | $132,360 |
| 2014 | $2,951 | $184,080 | $32,400 | $151,680 |
Source: Public Records
Map
Nearby Homes
- 2760 Camp Branch Rd
- 2655 Camp Branch Rd
- 2856 Habibi Ct
- Hawkins Plan at Towns at Ivy Creek
- Smyrna Plan at Towns at Ivy Creek
- 2802 Nettle Ln
- 2841 Trailing Ivy Way
- 2508 Morgan Chase Dr
- 2500 Morgan Chase Dr
- 2729 Morgan Glen Rd
- 2557 Woodford Ln
- 2493 Walnut Tree Ln Unit 1
- 2507 Gristhaven Ln
- 2687 Black Fox Ct
- 2299 Misty Ivy Ct
- 2423 Walnut Tree Ln Unit 1
- 2805 Ivy Hill Dr
- 2524 Ivy Plantation Dr
- 2544 Ivy Plantation Dr
- 2539 Ivy Plantation Dr
- 2564 Ivy Plantation Dr
- 2504 Ivy Plantation Dr
- 2549 Ivy Plantation Dr
- 2549 Ivy Plantation Dr Unit 23
- 0 Ivy Plantation Dr Unit 9039450
- 0 Ivy Plantation Dr Unit 7374139
- 0 Ivy Plantation Dr Unit 7493833
- 0 Ivy Plantation Dr Unit 8160354
- 2559 Ivy Plantation Dr
- 2529 Ivy Plantation Dr Unit 2
- 2565 Ginger Dr
- 2519 Ivy Plantation Dr
- 2555 Ginger Dr
- 2575 Ginger Dr
- 2494 Ivy Plantation Dr Unit 2
- 2574 Ivy Plantation Dr Unit 2
- 0 Florence Ann Terrace Unit 3171497