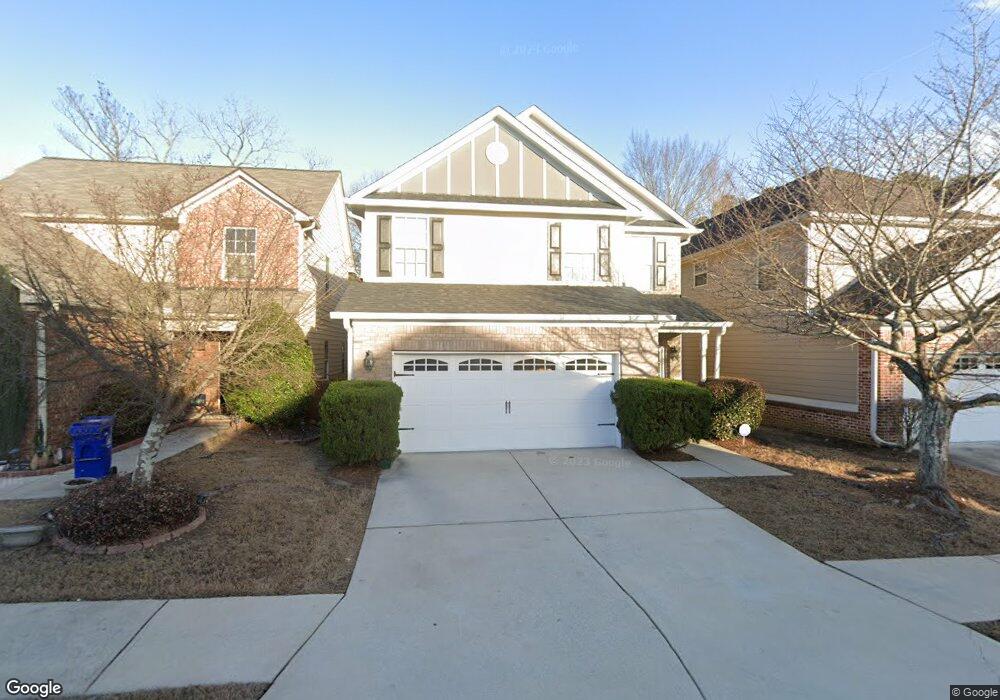
2534 Oakleaf Ridge Unit 65 Lithonia, GA 30058
Estimated Value: $267,000 - $314,000
3
Beds
3
Baths
1,901
Sq Ft
$149/Sq Ft
Est. Value
About This Home
This home is located at 2534 Oakleaf Ridge Unit 65, Lithonia, GA 30058 and is currently estimated at $282,710, approximately $148 per square foot. 2534 Oakleaf Ridge Unit 65 is a home located in DeKalb County with nearby schools including Stoneview Elementary School, Lithonia Middle School, and Lithonia High School.
Ownership History
Date
Name
Owned For
Owner Type
Purchase Details
Closed on
Apr 4, 2014
Sold by
City Of Hope Ministries In
Bought by
Massey Calandra Kenyetta
Current Estimated Value
Home Financials for this Owner
Home Financials are based on the most recent Mortgage that was taken out on this home.
Original Mortgage
$74,623
Outstanding Balance
$56,368
Interest Rate
4.25%
Mortgage Type
FHA
Estimated Equity
$226,342
Purchase Details
Closed on
May 28, 2009
Sold by
Security Bank Of Gwinnett Cnty
Bought by
City Of Hope Ministries Inc
Purchase Details
Closed on
Jul 13, 2006
Sold by
Windgate Inc
Bought by
Shermark Homes Inc
Home Financials for this Owner
Home Financials are based on the most recent Mortgage that was taken out on this home.
Original Mortgage
$150,400
Interest Rate
6.71%
Create a Home Valuation Report for This Property
The Home Valuation Report is an in-depth analysis detailing your home's value as well as a comparison with similar homes in the area
Home Values in the Area
Average Home Value in this Area
Purchase History
| Date | Buyer | Sale Price | Title Company |
|---|---|---|---|
| Massey Calandra Kenyetta | $76,000 | -- | |
| City Of Hope Ministries Inc | $107,000 | -- | |
| City Of Hope Ministries Inc | $107,000 | -- | |
| Shermark Homes Inc | $49,900 | -- |
Source: Public Records
Mortgage History
| Date | Status | Borrower | Loan Amount |
|---|---|---|---|
| Open | Massey Calandra Kenyetta | $74,623 | |
| Closed | Massey Calandra Kenyetta | $4,800 | |
| Previous Owner | Shermark Homes Inc | $150,400 |
Source: Public Records
Tax History Compared to Growth
Tax History
| Year | Tax Paid | Tax Assessment Tax Assessment Total Assessment is a certain percentage of the fair market value that is determined by local assessors to be the total taxable value of land and additions on the property. | Land | Improvement |
|---|---|---|---|---|
| 2025 | $4,361 | $116,400 | $18,000 | $98,400 |
| 2024 | $4,459 | $118,640 | $18,000 | $100,640 |
| 2023 | $4,459 | $124,080 | $18,000 | $106,080 |
| 2022 | $3,534 | $98,960 | $10,480 | $88,480 |
| 2021 | $2,571 | $75,080 | $10,480 | $64,600 |
| 2020 | $2,445 | $68,680 | $10,480 | $58,200 |
| 2019 | $2,470 | $67,960 | $10,480 | $57,480 |
| 2018 | $1,966 | $60,480 | $10,480 | $50,000 |
| 2017 | $2,166 | $53,480 | $10,480 | $43,000 |
| 2016 | $2,324 | $55,040 | $10,480 | $44,560 |
| 2014 | $2,086 | $31,160 | $10,480 | $20,680 |
Source: Public Records
Map
Nearby Homes
- 1405 Rock Chapel Rd
- 6976 Braswell St
- 3021 Stone Mountain St
- 2378 Randall Ave
- 6979 Bruce Cir
- 2523 Bruce St
- 6860 Parkway Dr
- 6860 Robinson St
- 2633 Council St
- 2516 Albert Way
- 2698 Council St
- 6895 Magnolia St
- 6893 Magnolia St
- 7217 Union Grove Rd
- 2706 S Wiggins St
- 7878 Covington Hwy
- 2653 Parkway Trail
- 2739 Council St
- 6436 Parkway Trace
- 2530 Oakleaf Ridge
- 2534 Oakleaf Ridge
- 2528 Oakleaf Ridge
- 2536 Oakleaf Ridge
- 2526 Oakleaf Ridge
- 2538 Oakleaf Ridge
- 2540 Oakleaf Ridge
- 2537 Oakleaf Ridge
- 2535 Oakleaf Ridge
- 2520 Oakleaf Ridge
- 2507 Oakleaf Ridge Unit 105
- 2507 Oakleaf Ridge
- 2531 Oakleaf Ridge
- 2541 Oakleaf Ridge
- 2539 Oakleaf Ridge
- 2367 Avery St
- 2542 Oakleaf Ridge
- 2518 Oakleaf Ridge
- 2543 Oakleaf Ridge
- 2529 Oakleaf Ridge