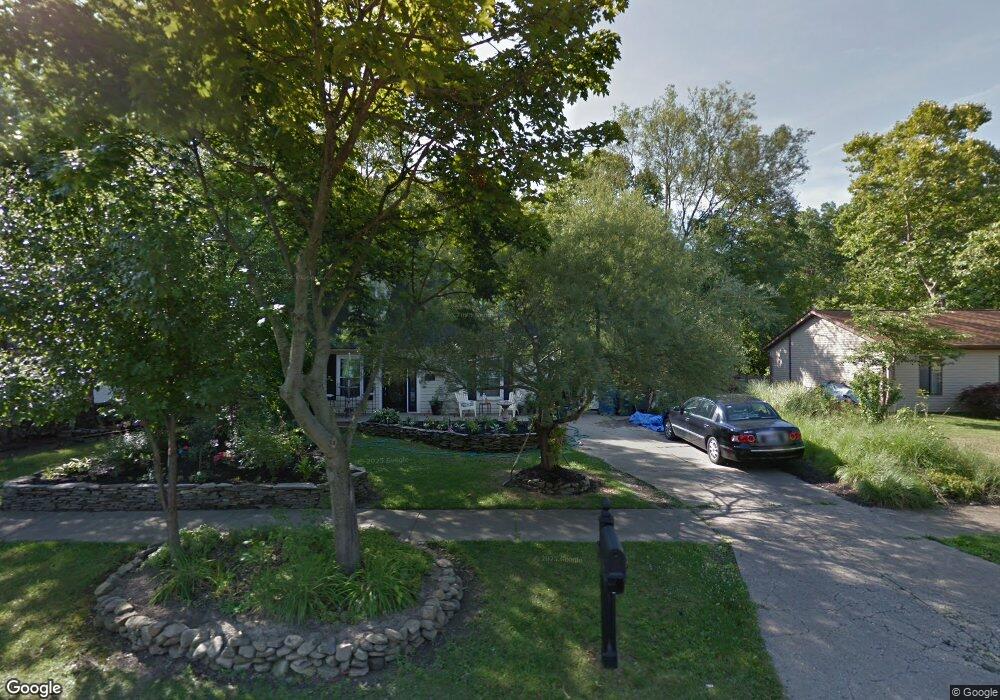
25345 Tyndall Falls Dr Olmsted Falls, OH 44138
Estimated Value: $286,000 - $321,000
3
Beds
2
Baths
1,176
Sq Ft
$257/Sq Ft
Est. Value
About This Home
This home is located at 25345 Tyndall Falls Dr, Olmsted Falls, OH 44138 and is currently estimated at $301,777, approximately $256 per square foot. 25345 Tyndall Falls Dr is a home located in Cuyahoga County with nearby schools including Falls-Lenox Primary Elementary School, Olmsted Falls Intermediate Building, and Olmsted Falls Middle School.
Ownership History
Date
Name
Owned For
Owner Type
Purchase Details
Closed on
May 23, 1998
Sold by
Cook Joann
Bought by
Brownrigg Debra A
Current Estimated Value
Home Financials for this Owner
Home Financials are based on the most recent Mortgage that was taken out on this home.
Original Mortgage
$118,750
Outstanding Balance
$23,446
Interest Rate
7.22%
Estimated Equity
$278,331
Purchase Details
Closed on
Dec 2, 1986
Sold by
Davis Renee
Bought by
Cook Jo Ann
Purchase Details
Closed on
May 14, 1985
Bought by
Davis Renee
Purchase Details
Closed on
Jan 4, 1983
Bought by
First Fed S&L Bank
Purchase Details
Closed on
Jan 1, 1981
Bought by
Gibson Partners Inc
Create a Home Valuation Report for This Property
The Home Valuation Report is an in-depth analysis detailing your home's value as well as a comparison with similar homes in the area
Home Values in the Area
Average Home Value in this Area
Purchase History
| Date | Buyer | Sale Price | Title Company |
|---|---|---|---|
| Brownrigg Debra A | $140,500 | 701761 Chicago Title | |
| Cook Jo Ann | $78,900 | -- | |
| Davis Renee | $74,700 | -- | |
| Shore West Const Co | -- | -- | |
| First Fed S&L Bank | -- | -- | |
| Gibson Partners Inc | -- | -- |
Source: Public Records
Mortgage History
| Date | Status | Borrower | Loan Amount |
|---|---|---|---|
| Open | Brownrigg Debra A | $118,750 |
Source: Public Records
Tax History Compared to Growth
Tax History
| Year | Tax Paid | Tax Assessment Tax Assessment Total Assessment is a certain percentage of the fair market value that is determined by local assessors to be the total taxable value of land and additions on the property. | Land | Improvement |
|---|---|---|---|---|
| 2024 | $5,642 | $96,285 | $21,035 | $75,250 |
| 2023 | $4,799 | $58,730 | $19,460 | $39,270 |
| 2022 | $4,471 | $160,300 | $55,600 | $104,700 |
| 2021 | $4,427 | $56,110 | $19,460 | $36,650 |
| 2020 | $4,368 | $49,210 | $17,080 | $32,130 |
| 2019 | $3,877 | $140,600 | $48,800 | $91,800 |
| 2018 | $4,045 | $49,210 | $17,080 | $32,130 |
| 2017 | $4,191 | $49,430 | $16,700 | $32,730 |
| 2016 | $4,169 | $49,430 | $16,700 | $32,730 |
| 2015 | $4,165 | $49,430 | $16,700 | $32,730 |
| 2014 | $4,165 | $46,060 | $15,750 | $30,310 |
Source: Public Records
Map
Nearby Homes
- 24628 Sprague Rd
- 9190 Waterfall Dr
- 9180 Waterfall Dr
- 9430 Columbia Rd
- Caroline Plan at Falls Landing - Villas
- Wexford Plan at Falls Landing - Villas
- Rosecliff Plan at Falls Landing - Villas
- 9855 Dupont Dr
- Anderson Plan at Smokestack Trails
- Bramante Ranch Plan at Smokestack Trails
- Hudson Plan at Smokestack Trails
- Columbia Plan at Smokestack Trails
- Lehigh Plan at Smokestack Trails
- 26179 Raintree Blvd Unit D8
- V/L Aldridge Dr
- 26187 Raintree Blvd Unit C5
- 26183 Raintree Blvd Unit C-10
- 23514 Grist Mill Ct Unit 4
- 23390 Wainwright Terrace
- 8757 Roberts Ct Unit 25C
- 25341 Tyndall Falls Dr
- 25349 Tyndall Falls Dr
- 25339 Tyndall Falls Dr
- 25353 Tyndall Falls Dr
- 25350 Tyndall Falls Dr
- 25335 Tyndall Falls Dr
- 25357 Tyndall Falls Dr
- 25354 Tyndall Falls Dr
- 9551 Glencairn Ln
- 9546 Glencairn Ln
- 24624 Briarwood Dr
- 25361 Tyndall Falls Dr
- 25334 Tyndall Falls Dr
- 9542 Glencairn Ln
- 25366 Tyndall Falls Dr
- 25365 Tyndall Falls Dr
- 9547 Glencairn Ln
- 24636 Scott Blvd
- 25327 Tyndall Falls Dr
- 25330 Tyndall Falls Dr