Estimated Value: $749,000 - $847,000
4
Beds
3
Baths
2,836
Sq Ft
$282/Sq Ft
Est. Value
About This Home
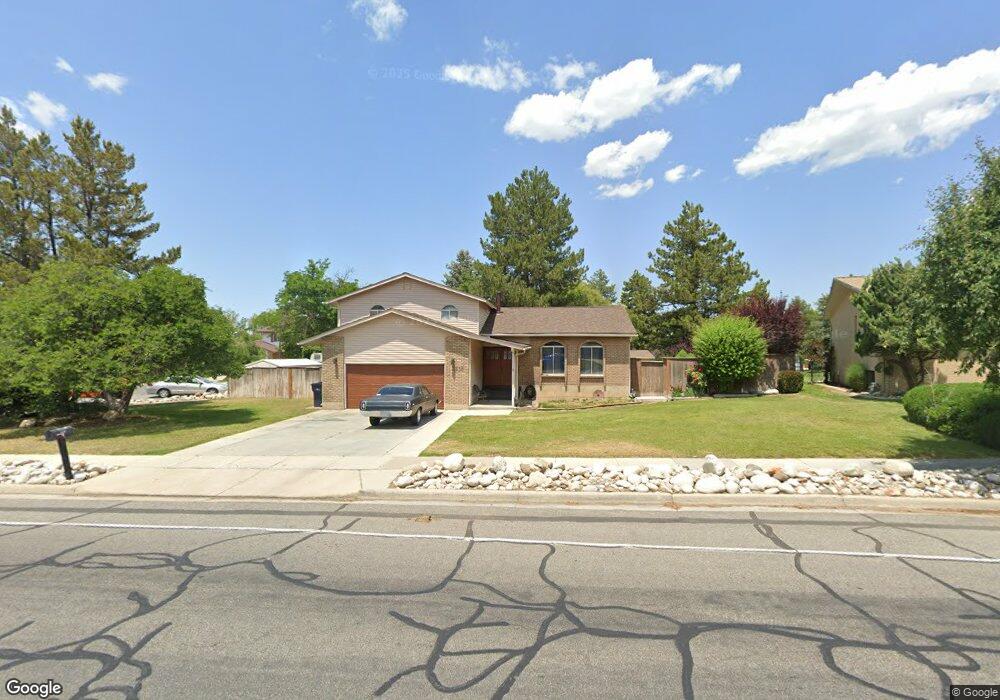
This home is located at 2535 Alta Canyon Dr, Sandy, UT 84093 and is currently estimated at $798,505, approximately $281 per square foot. 2535 Alta Canyon Dr is a home located in Salt Lake County with nearby schools including Brookwood Elementary School, Albion Middle School, and Brighton High School.
Ownership History
Date
Name
Owned For
Owner Type
Purchase Details
Closed on
Dec 5, 2022
Sold by
Brooks Steven Scott
Bought by
Brooks Living Trust
Current Estimated Value
Purchase Details
Closed on
Jul 22, 2010
Sold by
Brooks Barbara
Bought by
Brooks Scott
Home Financials for this Owner
Home Financials are based on the most recent Mortgage that was taken out on this home.
Original Mortgage
$225,000
Interest Rate
4.68%
Mortgage Type
New Conventional
Purchase Details
Closed on
Mar 12, 2010
Sold by
Brooks Barbara
Bought by
Brooks Scott
Purchase Details
Closed on
Feb 5, 2002
Sold by
Brooks Jack J and Brooks Julie L
Bought by
Brooks Scott and Brooks Barbara
Home Financials for this Owner
Home Financials are based on the most recent Mortgage that was taken out on this home.
Original Mortgage
$161,600
Interest Rate
7.15%
Create a Home Valuation Report for This Property
The Home Valuation Report is an in-depth analysis detailing your home's value as well as a comparison with similar homes in the area
Home Values in the Area
Average Home Value in this Area
Purchase History
| Date | Buyer | Sale Price | Title Company |
|---|---|---|---|
| Brooks Living Trust | -- | -- | |
| Brooks Scott | -- | Inwest Title Services | |
| Brooks Scott | -- | Accommodation | |
| Brooks Scott | -- | First American Title |
Source: Public Records
Mortgage History
| Date | Status | Borrower | Loan Amount |
|---|---|---|---|
| Previous Owner | Brooks Scott | $225,000 | |
| Previous Owner | Brooks Scott | $161,600 |
Source: Public Records
Tax History Compared to Growth
Tax History
| Year | Tax Paid | Tax Assessment Tax Assessment Total Assessment is a certain percentage of the fair market value that is determined by local assessors to be the total taxable value of land and additions on the property. | Land | Improvement |
|---|---|---|---|---|
| 2025 | $3,579 | $671,200 | $330,600 | $340,600 |
| 2024 | $3,579 | $670,800 | $318,200 | $352,600 |
| 2023 | $3,419 | $639,800 | $306,000 | $333,800 |
| 2022 | $3,399 | $625,600 | $300,000 | $325,600 |
| 2021 | $2,858 | $447,800 | $240,100 | $207,700 |
| 2020 | $2,647 | $391,500 | $240,100 | $151,400 |
| 2019 | $2,656 | $383,200 | $226,600 | $156,600 |
| 2018 | $2,414 | $364,200 | $226,600 | $137,600 |
| 2017 | $2,448 | $353,300 | $226,600 | $126,700 |
| 2016 | $2,398 | $334,600 | $204,100 | $130,500 |
| 2015 | $2,449 | $316,800 | $185,400 | $131,400 |
| 2014 | $2,283 | $290,100 | $175,200 | $114,900 |
Source: Public Records
Map
Nearby Homes
- 8597 Mount Majestic Rd
- 2646 Snow Mountain Dr
- 2311 Snow Mountain Dr
- 8290 Escalante Dr
- 2650 Willow Wick Dr
- 8211 S 2660 E
- 2509 E Cobblestone Way
- 2774 Robidoux Rd
- 2167 E Alta Cove Cir
- 8965 Quail Run Dr
- 2131 Gad Way
- 2614 E Tuxedo Cir
- 8571 Monitor Dr
- 9034 Cheshire Cir
- 2271 E Alta Canyon Dr
- 9061 S Newcastle Cir
- 8916 Cobble Crest Ln
- 2043 E Brady Creek Cir
- 2120 E Newcastle Dr
- 8483 S Terrace Dr
- 2521 E Alta Canyon Cir
- 2521 Alta Canyon Cir
- 2551 Alta Canyon Dr
- 2551 E Alta Canyon Dr
- 2534 Alta Canyon Dr
- 2505 Alta Canyon Cir
- 2550 Alta Canyon Dr
- 2550 E Alta Canyon Dr
- 2467 E Alta Canyon Cir
- 2567 Alta Canyon Dr
- 2467 Alta Canyon Cir
- 2479 E Alta Canyon Cir
- 2479 Alta Canyon Cir
- 2577 Alta Canyon Dr
- 8569 S Escalante Dr
- 2577 E Alta Canyon Dr
- 8591 S Snowbird Dr
- 8591 Snowbird Dr
- 8569 Escalante Dr
- 8581 Escalante Dr