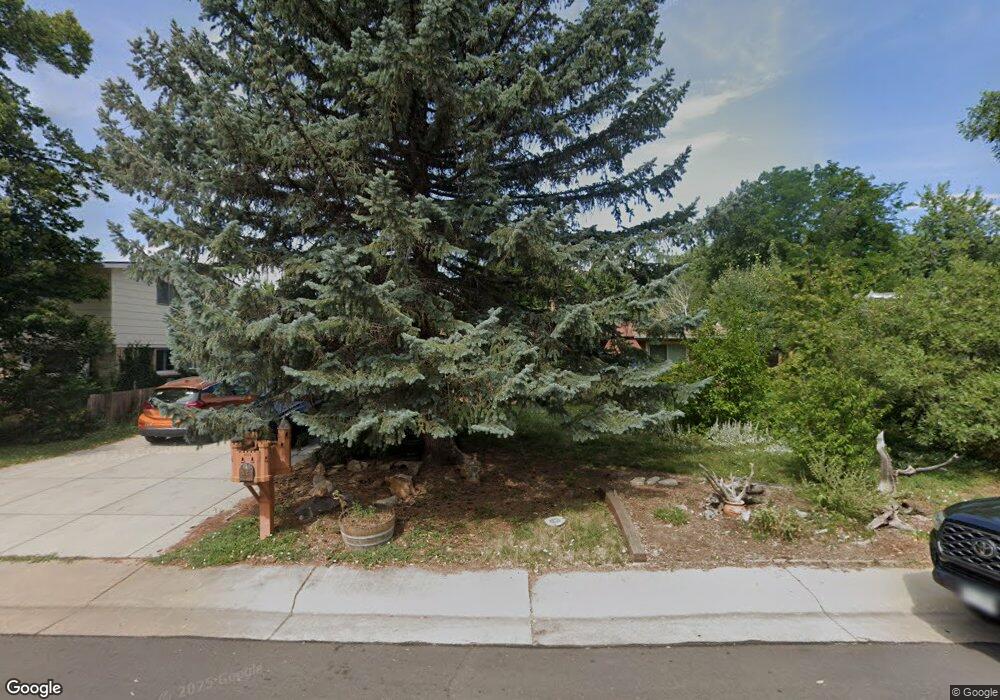
2535 Carr Ct Lakewood, CO 80215
Morse Park NeighborhoodEstimated Value: $513,000 - $589,000
2
Beds
1
Bath
1,077
Sq Ft
$497/Sq Ft
Est. Value
About This Home
This home is located at 2535 Carr Ct, Lakewood, CO 80215 and is currently estimated at $534,983, approximately $496 per square foot. 2535 Carr Ct is a home located in Jefferson County with nearby schools including Slater Elementary School, Lakewood High School, and Beth Eden Baptist School.
Ownership History
Date
Name
Owned For
Owner Type
Purchase Details
Closed on
Jun 9, 2023
Sold by
Hueseman Bruce Wayne
Bought by
Hueseman Akasha
Current Estimated Value
Purchase Details
Closed on
Aug 29, 2003
Sold by
Samson Lance E
Bought by
Hueseman Bruce W
Home Financials for this Owner
Home Financials are based on the most recent Mortgage that was taken out on this home.
Original Mortgage
$100,000
Interest Rate
5.37%
Mortgage Type
New Conventional
Purchase Details
Closed on
Aug 14, 2000
Sold by
United Financial Group Llc
Bought by
Samson Lance E
Home Financials for this Owner
Home Financials are based on the most recent Mortgage that was taken out on this home.
Original Mortgage
$124,000
Interest Rate
8.21%
Purchase Details
Closed on
Oct 6, 1999
Sold by
Allan Davis Timmothy
Bought by
United Financial Group Llc
Create a Home Valuation Report for This Property
The Home Valuation Report is an in-depth analysis detailing your home's value as well as a comparison with similar homes in the area
Home Values in the Area
Average Home Value in this Area
Purchase History
| Date | Buyer | Sale Price | Title Company |
|---|---|---|---|
| Hueseman Akasha | -- | None Listed On Document | |
| Hueseman Bruce W | $185,000 | First American Heritage Titl | |
| Samson Lance E | $155,000 | -- | |
| United Financial Group Llc | -- | -- |
Source: Public Records
Mortgage History
| Date | Status | Borrower | Loan Amount |
|---|---|---|---|
| Previous Owner | Hueseman Bruce W | $100,000 | |
| Previous Owner | Samson Lance E | $124,000 | |
| Closed | Hueseman Bruce W | $70,750 |
Source: Public Records
Tax History Compared to Growth
Tax History
| Year | Tax Paid | Tax Assessment Tax Assessment Total Assessment is a certain percentage of the fair market value that is determined by local assessors to be the total taxable value of land and additions on the property. | Land | Improvement |
|---|---|---|---|---|
| 2024 | $2,028 | $29,190 | $16,382 | $12,808 |
| 2023 | $2,028 | $29,190 | $16,382 | $12,808 |
| 2022 | $1,915 | $27,709 | $15,637 | $12,072 |
| 2021 | $1,942 | $28,506 | $16,087 | $12,419 |
| 2020 | $1,684 | $25,744 | $13,579 | $12,165 |
| 2019 | $1,662 | $25,744 | $13,579 | $12,165 |
| 2018 | $1,488 | $23,303 | $9,526 | $13,777 |
| 2017 | $1,308 | $23,303 | $9,526 | $13,777 |
| 2016 | $958 | $18,960 | $7,856 | $11,104 |
| 2015 | $740 | $18,960 | $7,856 | $11,104 |
| 2014 | $740 | $15,579 | $7,794 | $7,785 |
Source: Public Records
Map
Nearby Homes
- 2301 Brentwood St
- 2295 Estes St
- 2212 Ammons St
- 8211 Rocky Mountain Dr
- 7650 W 24th Ave
- 1991 Glen Garry Dr
- 7625 W 23rd Place
- 2580 Hoyt St
- 7800 W 20th Ave
- 8075 W 32nd Ave
- 3200 Zephyr Ct
- 2060 Hoyt St
- 3240 Zephyr Ct
- 3225 Yarrow Ct
- 3334 Zephyr Ct
- 7350 W 21st Ave
- 7265 W 27th Ave
- 3381 Yarrow St
- 9100 W 35th Ave
- 1600 Balsam St