
Seller's Agent in 2025
Maria Severino - Roller
First Team Real Estate
(760) 415-2217
8 in this area
64 Total Sales
Estimated Value: $674,043 - $705,000
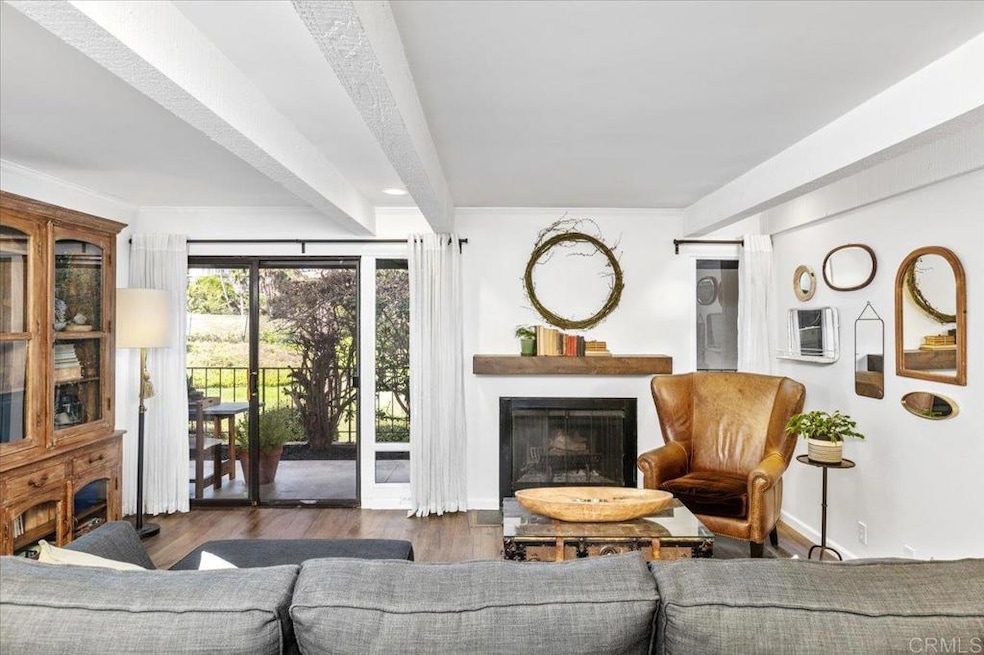
Showing as a 2-bedroom, this rare single-level, turn-key end unit could be yours. Perfectly located in the heart of La Costa-just minutes from the beach-this home overlooks the 3rd hole of the Omni La Costa Golf Course with gorgeous, uninterrupted views. Every inch of this open-concept retreat has been thoughtfully upgraded and is truly move-in ready: luxury vinyl plank flooring, Carrera marble countertops in the kitchen, Carrera marble floors in both bathrooms, and added storage throughout set the tone for elevated living. The living room is anchored by a wood-burning fireplace. With western exposure, the home is filled with immense natural light, while three sets of sliding doors open to an expansive, private patio, creating the perfect backdrop for quiet mornings or sunset toasts. The stunning kitchen with stainless steel appliances and a farmhouse sink is designed for both barefoot baking and intimate dinner parties. The primary bedroom features two custom built-in closets, while the en-suite includes an oversized dressing area, traditional closet, a secondary closet, and in-unit laundry. In addition to the office nook a 2nd room added as a bedroom could be your next big idea - library, studio, meditation space you decide. Upgraded doors, trim, hardware, lighting fixtures, ceiling fan, custom mantle and HVAC to boot. Two designated spaces, community pool, jacuzzi, and sauna - boutique shops, and restaurants around the corner. Translation: beach walks, great schools, swims, spritzes, and sourdough starters are all within your orbit. If you’re already picturing yourself here...yeah, so is everyone else.
Last Agent to Sell the Property
First Team Real Estate Brokerage Email: mariaroller@calresinc.com License #01866324 Listed on: 09/15/2025
Last Buyer's Agent
First Team Real Estate Brokerage Email: mariaroller@calresinc.com License #01866324 Listed on: 09/15/2025
| Date | Buyer | Sale Price | Title Company |
|---|---|---|---|
| Sida Jill | $690,000 | Fidelity National Title | |
| Schriek Louise Ellen | $170,000 | Fidelity National Title | |
| Nohl Anabel | -- | Fidelity National Title Co | |
| -- | $93,900 | -- |
| Date | Status | Borrower | Loan Amount |
|---|---|---|---|
| Open | Sida Jill | $517,500 | |
| Previous Owner | Schriek Louise Ellen | $135,900 | |
| Previous Owner | Nohl Anabel | $86,000 | |
| Closed | Schriek Louise Ellen | $25,500 |
| Date | Event | Price | List to Sale | Price per Sq Ft |
|---|---|---|---|---|
| 10/22/2025 10/22/25 | Sold | $690,000 | +0.7% | $580 / Sq Ft |
| 09/21/2025 09/21/25 | Pending | -- | -- | -- |
| 09/15/2025 09/15/25 | For Sale | $685,000 | -- | $576 / Sq Ft |
| Year | Tax Paid | Tax Assessment Tax Assessment Total Assessment is a certain percentage of the fair market value that is determined by local assessors to be the total taxable value of land and additions on the property. | Land | Improvement |
|---|---|---|---|---|
| 2025 | $3,212 | $255,989 | $109,045 | $146,944 |
| 2024 | $3,212 | $250,970 | $106,907 | $144,063 |
| 2023 | $3,091 | $246,050 | $104,811 | $141,239 |
| 2022 | $2,997 | $241,226 | $102,756 | $138,470 |
| 2021 | $2,928 | $236,497 | $100,742 | $135,755 |
| 2020 | $2,862 | $234,073 | $99,710 | $134,363 |
| 2019 | $2,810 | $229,484 | $97,755 | $131,729 |
| 2018 | $2,762 | $224,986 | $95,839 | $129,147 |
| 2017 | $90 | $220,575 | $93,960 | $126,615 |
| 2016 | $2,641 | $216,251 | $92,118 | $124,133 |
| 2015 | $2,578 | $213,004 | $90,735 | $122,269 |
| 2014 | $2,506 | $208,832 | $88,958 | $119,874 |
Seller's Agent in 2025
Maria Severino - Roller
First Team Real Estate
(760) 415-2217
8 in this area
64 Total Sales
Source: California Regional Multiple Listing Service (CRMLS)
MLS Number: NDP2509061
APN: 216-170-54-12
Disclaimer: Certain information contained herein is derived from information provided by parties other than Homes.com. All information provided is deemed reliable, but is not guaranteed to be accurate and should be independently verified.
![]() The multiple listing data appearing on this website, or contained in reports produced therefrom, is owned and copyrighted by California Regional Multiple Listing Service, Inc. ("CRMLS") and is protected by all applicable copyright laws. Information provided is for viewer's personal, non-commercial use and may not be used for any purpose other than to identify prospective properties the viewer may be interested in purchasing. All listing data, including but not limited to square footage and lot size is believed to be accurate, but the listing Agent, listing Broker and CRMLS and its affiliates do not warrant or guarantee such accuracy. The viewer should independently verify the listed data prior to making any decisions based on such information by personal inspection and/or contacting a real estate professional.
The multiple listing data appearing on this website, or contained in reports produced therefrom, is owned and copyrighted by California Regional Multiple Listing Service, Inc. ("CRMLS") and is protected by all applicable copyright laws. Information provided is for viewer's personal, non-commercial use and may not be used for any purpose other than to identify prospective properties the viewer may be interested in purchasing. All listing data, including but not limited to square footage and lot size is believed to be accurate, but the listing Agent, listing Broker and CRMLS and its affiliates do not warrant or guarantee such accuracy. The viewer should independently verify the listed data prior to making any decisions based on such information by personal inspection and/or contacting a real estate professional.
Based on information from California Regional Multiple Listing Service, Inc. and /or other sources. All data, including all measurements and calculations of area, is obtained from various sources and has not been, and will not be, verified by broker or MLS. All information should be independently reviewed and verified for accuracy. Properties may or may not be listed by the office/agent presenting the information
Ask me questions while you tour the home.