Estimated Value: $565,000 - $696,000
2
Beds
3
Baths
2,051
Sq Ft
$305/Sq Ft
Est. Value
About This Home
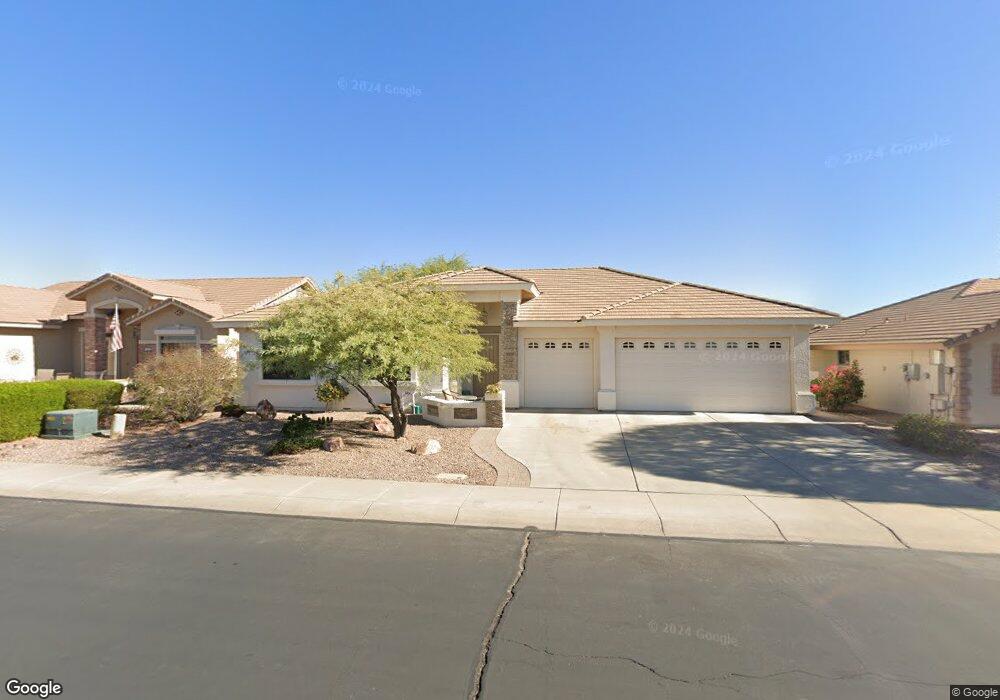
This home is located at 2535 S Wattlewood, Mesa, AZ 85209 and is currently estimated at $625,615, approximately $305 per square foot. 2535 S Wattlewood is a home located in Maricopa County with nearby schools including Augusta Ranch Elementary School, Desert Ridge Jr. High School, and Desert Ridge High School.
Ownership History
Date
Name
Owned For
Owner Type
Purchase Details
Closed on
Nov 13, 2023
Sold by
Genenbacher Elaine A
Bought by
Elaine A Genenbacher Trust and Genenbacher
Current Estimated Value
Purchase Details
Closed on
Sep 8, 2023
Sold by
Russell P Esposito P and Russell Dorothy A
Bought by
Genenbacher Elaine A
Purchase Details
Closed on
Oct 21, 2013
Sold by
Esposito Russell P and Esposito Dorothy A
Bought by
Esposito Russell P and Esposito Dorothy A
Purchase Details
Closed on
May 14, 2009
Sold by
Westman Lorin L and Westman Terri L
Bought by
Esposito Russell P and Esposito Dorothy A
Purchase Details
Closed on
Aug 26, 2005
Sold by
Transnation Title Insurance Co
Bought by
Wetman Lorin L and Westman Terri L
Home Financials for this Owner
Home Financials are based on the most recent Mortgage that was taken out on this home.
Original Mortgage
$220,000
Interest Rate
5.67%
Mortgage Type
New Conventional
Create a Home Valuation Report for This Property
The Home Valuation Report is an in-depth analysis detailing your home's value as well as a comparison with similar homes in the area
Home Values in the Area
Average Home Value in this Area
Purchase History
| Date | Buyer | Sale Price | Title Company |
|---|---|---|---|
| Elaine A Genenbacher Trust | -- | None Listed On Document | |
| Genenbacher Elaine A | -- | None Listed On Document | |
| Esposito Russell P | -- | None Available | |
| Esposito Russell P | $409,000 | Security Title Agency | |
| Wetman Lorin L | $356,067 | -- |
Source: Public Records
Mortgage History
| Date | Status | Borrower | Loan Amount |
|---|---|---|---|
| Previous Owner | Wetman Lorin L | $220,000 |
Source: Public Records
Tax History Compared to Growth
Tax History
| Year | Tax Paid | Tax Assessment Tax Assessment Total Assessment is a certain percentage of the fair market value that is determined by local assessors to be the total taxable value of land and additions on the property. | Land | Improvement |
|---|---|---|---|---|
| 2025 | $3,082 | $42,628 | -- | -- |
| 2024 | $3,103 | $40,598 | -- | -- |
| 2023 | $3,103 | $48,760 | $9,750 | $39,010 |
| 2022 | $3,020 | $40,750 | $8,150 | $32,600 |
| 2021 | $3,237 | $38,570 | $7,710 | $30,860 |
| 2020 | $3,181 | $33,400 | $6,680 | $26,720 |
| 2019 | $2,976 | $32,110 | $6,420 | $25,690 |
| 2018 | $3,106 | $33,330 | $6,660 | $26,670 |
| 2017 | $3,081 | $33,050 | $6,610 | $26,440 |
| 2016 | $3,165 | $32,320 | $6,460 | $25,860 |
| 2015 | $2,910 | $31,530 | $6,300 | $25,230 |
Source: Public Records
Map
Nearby Homes
- 2559 S Wattlewood
- 11056 E Neville Ave
- 11027 E Natal Ave
- 11046 E Naranja Ave Unit 5
- 10960 E Monte Ave Unit 257
- 10960 E Monte Ave Unit 238
- 10960 E Monte Ave Unit 101
- 10960 E Monte Ave Unit 242
- 11259 E Medina Ave
- 11205 E Laguna Azul Cir
- 11314 E Neville Ave Unit 3
- 11328 E Mendoza Ave
- 11343 E Milagro Ave
- 11259 E Laguna Azul Cir
- 11360 E Monte Cir
- 11338 E Neville Ave
- 11069 E Kilarea Ave Unit 194
- 11069 E Kilarea Ave Unit 198
- 2740 S Teakwood Cir
- 11303 E Laguna Azul Cir
- 2527 S Wattlewood
- 2543 S Wattlewood
- 2551 S Wattlewood
- 2519 S Wattlewood
- 2511 S Wattlewood
- 11062 E Monte Ave
- 11056 E Monte Ave
- 2565 S Wattlewood
- 11050 E Monte Ave
- 2605 S Wattlewood
- 11063 E Monte Ave
- 11044 E Monte Ave
- 11057 E Monte Ave
- 11051 E Monte Ave
- 2611 S Wattlewood
- 11038 E Monte Ave
- 11064 E Natal Ave
- 11045 E Monte Ave
- 11058 E Natal Ave
- 11032 E Monte Ave