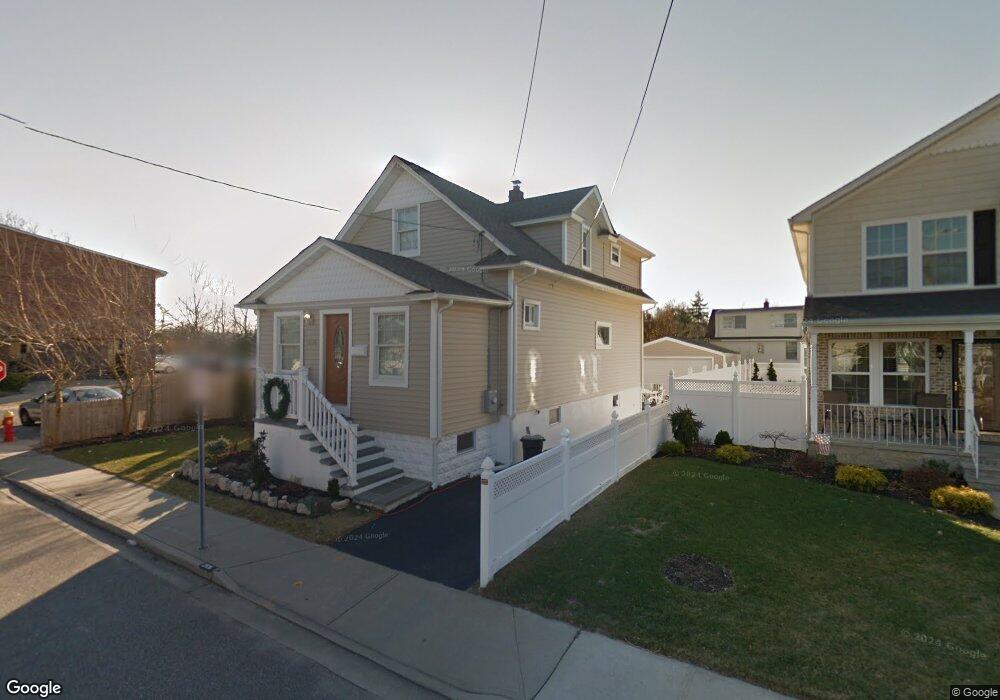
2536 Centre Ave Bellmore, NY 11710
Estimated Value: $713,702 - $795,000
--
Bed
2
Baths
1,278
Sq Ft
$590/Sq Ft
Est. Value
About This Home
This home is located at 2536 Centre Ave, Bellmore, NY 11710 and is currently estimated at $754,351, approximately $590 per square foot. 2536 Centre Ave is a home located in Nassau County with nearby schools including Lt. General Thomas P. Stafford Elementary School, Winthrop Avenue School, and Shore Road School.
Ownership History
Date
Name
Owned For
Owner Type
Purchase Details
Closed on
Jan 31, 2022
Sold by
Debonis Daniel M
Bought by
Figuerora Anthony and Andrade Martha P
Current Estimated Value
Home Financials for this Owner
Home Financials are based on the most recent Mortgage that was taken out on this home.
Original Mortgage
$522,750
Outstanding Balance
$485,413
Interest Rate
3.55%
Mortgage Type
New Conventional
Estimated Equity
$268,938
Purchase Details
Closed on
Feb 4, 2011
Sold by
Mt Sinai Avenue Properties Ltd
Bought by
Debonis Daniel M and Foster Jennifer L
Home Financials for this Owner
Home Financials are based on the most recent Mortgage that was taken out on this home.
Original Mortgage
$378,750
Interest Rate
4.5%
Mortgage Type
FHA
Purchase Details
Closed on
Apr 1, 2010
Sold by
Hsbc Bank N A
Bought by
Mount Sinai Avenue Properties Ltd
Purchase Details
Closed on
Feb 3, 2006
Sold by
Deriso Edna
Bought by
Hirsch Hannah
Create a Home Valuation Report for This Property
The Home Valuation Report is an in-depth analysis detailing your home's value as well as a comparison with similar homes in the area
Home Values in the Area
Average Home Value in this Area
Purchase History
| Date | Buyer | Sale Price | Title Company |
|---|---|---|---|
| Figuerora Anthony | $615,000 | None Available | |
| Debonis Daniel M | $395,000 | -- | |
| Mount Sinai Avenue Properties Ltd | $221,500 | -- | |
| Hirsch Hannah | $420,000 | -- |
Source: Public Records
Mortgage History
| Date | Status | Borrower | Loan Amount |
|---|---|---|---|
| Open | Figuerora Anthony | $522,750 | |
| Previous Owner | Debonis Daniel M | $378,750 |
Source: Public Records
Tax History Compared to Growth
Tax History
| Year | Tax Paid | Tax Assessment Tax Assessment Total Assessment is a certain percentage of the fair market value that is determined by local assessors to be the total taxable value of land and additions on the property. | Land | Improvement |
|---|---|---|---|---|
| 2025 | $12,878 | $424 | $182 | $242 |
| 2024 | $3,160 | $424 | $182 | $242 |
| 2023 | $11,908 | $424 | $182 | $242 |
| 2022 | $11,908 | $424 | $182 | $242 |
| 2021 | $16,288 | $406 | $174 | $232 |
| 2020 | $10,591 | $579 | $578 | $1 |
| 2019 | $2,750 | $579 | $470 | $109 |
| 2018 | $5,835 | $617 | $0 | $0 |
| 2017 | $7,606 | $823 | $668 | $155 |
| 2016 | $11,210 | $823 | $668 | $155 |
| 2015 | $3,357 | $823 | $600 | $223 |
| 2014 | $3,357 | $823 | $600 | $223 |
| 2013 | $3,151 | $823 | $668 | $155 |
Source: Public Records
Map
Nearby Homes
- 2573 Legion St
- 732 Sunrise Ave
- 2460 Centre Ave
- 906 Ardmore Place
- 199 Claxton Ave
- 2711 W Alder Rd
- 2741 Anthony Ave
- 2545 Horace Ct
- 2398 Centre Ave
- 2542 Lefferts Place
- 14 Island Plaza
- 14 Bell Ct
- 2523 Horace Ct
- 2476 Florin Ct
- 2406 Legion St
- 2492 Lefferts Place
- 107 1st Place
- 2747 Barbara Rd
- 116 Beach Ave
- 601 Hughes St
- 2536 Centre Ave
- 2524 Centre Ave
- 2520 Centre Ave
- 749 Sunrise Ave
- 801 Sunrise Ave
- 2535 Centre Ave
- 803 Sunrise Ave
- 2525 Centre Ave
- 2518 Centre Ave
- 745 Sunrise Ave
- 745 Sunrise Ave
- 805 Sunrise Ave
- 2519 Sunrise Ave
- 735 Centre Ave
- 807 Sunrise Ave
- 3 Short Ln
- 2515 Sunrise Ave
- 2588 Garden St
- 2588 Garden St Unit 1st Fl
- 2510 Centre Ave