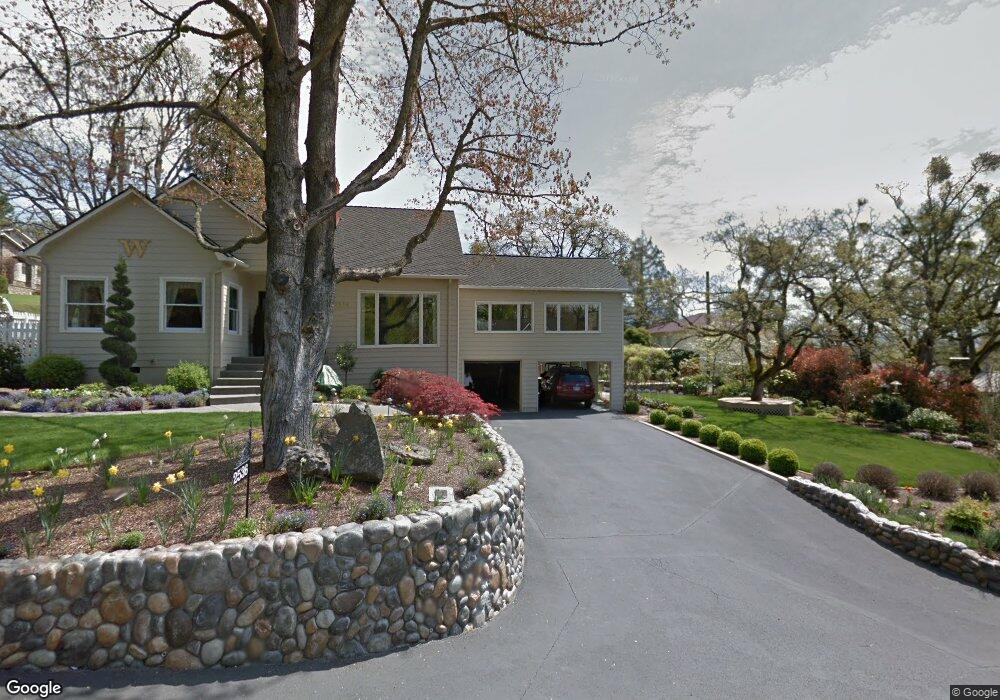
2536 Lyman Ave Medford, OR 97504
Estimated Value: $491,000 - $551,000
3
Beds
2
Baths
2,100
Sq Ft
$245/Sq Ft
Est. Value
About This Home
This home is located at 2536 Lyman Ave, Medford, OR 97504 and is currently estimated at $514,901, approximately $245 per square foot. 2536 Lyman Ave is a home located in Jackson County with nearby schools including Lone Pine Elementary School, Hedrick Middle School, and North Medford High School.
Ownership History
Date
Name
Owned For
Owner Type
Purchase Details
Closed on
Apr 9, 2012
Sold by
Warrington Stephen and Warrington Sue Ann
Bought by
Warrington Stephen and Warrington Sue Ann
Current Estimated Value
Purchase Details
Closed on
Nov 23, 2005
Sold by
Patterson Willard H and Patterson Marilyn L
Bought by
Warrington Stephen and Warrington Sue Ann
Home Financials for this Owner
Home Financials are based on the most recent Mortgage that was taken out on this home.
Original Mortgage
$312,800
Outstanding Balance
$170,655
Interest Rate
5.97%
Mortgage Type
Unknown
Estimated Equity
$344,246
Create a Home Valuation Report for This Property
The Home Valuation Report is an in-depth analysis detailing your home's value as well as a comparison with similar homes in the area
Home Values in the Area
Average Home Value in this Area
Purchase History
| Date | Buyer | Sale Price | Title Company |
|---|---|---|---|
| Warrington Stephen | -- | None Available | |
| Warrington Stephen | $391,000 | Lawyers Title Ins |
Source: Public Records
Mortgage History
| Date | Status | Borrower | Loan Amount |
|---|---|---|---|
| Open | Warrington Stephen | $312,800 |
Source: Public Records
Tax History Compared to Growth
Tax History
| Year | Tax Paid | Tax Assessment Tax Assessment Total Assessment is a certain percentage of the fair market value that is determined by local assessors to be the total taxable value of land and additions on the property. | Land | Improvement |
|---|---|---|---|---|
| 2025 | $3,959 | $273,020 | $89,250 | $183,770 |
| 2024 | $3,959 | $265,070 | $86,650 | $178,420 |
| 2023 | $3,838 | $257,350 | $84,120 | $173,230 |
| 2022 | $3,745 | $257,350 | $84,120 | $173,230 |
| 2021 | $3,648 | $249,860 | $81,680 | $168,180 |
| 2020 | $3,571 | $242,590 | $79,300 | $163,290 |
| 2019 | $3,486 | $228,670 | $74,740 | $153,930 |
| 2018 | $3,397 | $222,010 | $72,560 | $149,450 |
| 2017 | $3,336 | $222,010 | $72,560 | $149,450 |
| 2016 | $3,358 | $209,280 | $68,390 | $140,890 |
| 2015 | $3,227 | $209,280 | $68,390 | $140,890 |
| 2014 | -- | $197,280 | $64,470 | $132,810 |
Source: Public Records
Map
Nearby Homes
- 91 Black Oak Dr
- 721 Brookdale Ave
- 109 Kensington Square
- 164 Black Oak Dr
- 101 S Modoc Ave
- 740 N Modoc Ave
- 2020 Ridge Way
- 2233 Oakwood Dr
- 889 Valley View Dr
- 325 Sutter Ave
- 1925 Stratford Ave
- 312 N Barneburg Rd
- 1137 Riverrock Way
- 2556 Dellwood Ave
- 305 S Groveland Ave
- 1277 Gardendale Ave
- 1711 E Main St
- 1560 Cambridge Cir
- 1258 Paulita Dr
- 1744 Carrera Cir
- 2532 Lyman Ave
- 2608 Jackson Dr
- 2525 Lyman Ave
- 2607 Eastover Terrace
- 2618 Jackson Dr
- 2526 Lyman Ave
- 2618 Jackson Dr
- 2511 Lyman Ave
- 218 Saginaw Dr
- 2520 Lyman Ave
- 2595 Jackson Dr
- 2516 Lyman Ave
- 2533 Hillcrest Dr
- 2533 Hillcrest Rd
- 2607 Hillcrest Rd
- 2512 Lyman Ave
- 2627 Eastover Terrace
- 209 Saginaw Dr
- 2529 Hillcrest Rd
- 2509 Lyman Ave