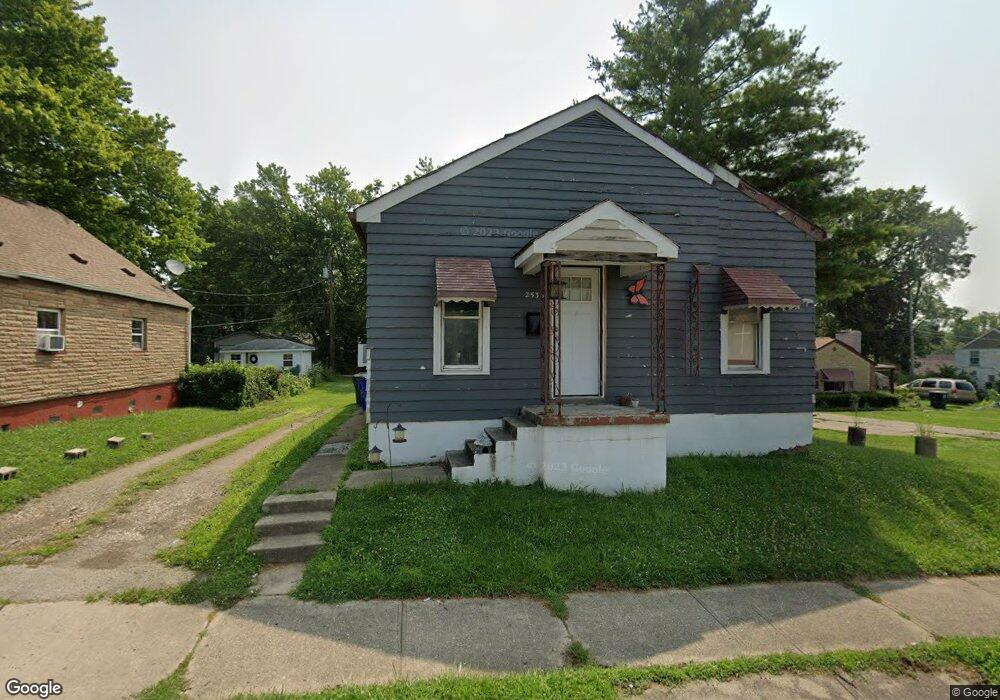
2536 N Gettysburg Ave Dayton, OH 45406
Northern Hills NeighborhoodEstimated Value: $74,000 - $103,000
2
Beds
1
Bath
960
Sq Ft
$88/Sq Ft
Est. Value
About This Home
This home is located at 2536 N Gettysburg Ave, Dayton, OH 45406 and is currently estimated at $84,703, approximately $88 per square foot. 2536 N Gettysburg Ave is a home located in Montgomery County with nearby schools including Valerie Elementary School, Imagine Klepinger Road Community School, and North Dayton School of Science & Discovery.
Ownership History
Date
Name
Owned For
Owner Type
Purchase Details
Closed on
Jan 2, 2018
Sold by
Okinbia Investment Properties Llc
Bought by
Manzo Pedro Vargas
Current Estimated Value
Purchase Details
Closed on
Oct 31, 2017
Sold by
Thornton Christopher W and Thornton Christopher
Bought by
Okinbia Investment Propeilics Llc
Purchase Details
Closed on
Sep 29, 2017
Sold by
Hintt Kely
Bought by
Thornton Christopher
Purchase Details
Closed on
Feb 27, 2017
Sold by
Philip Brandy
Bought by
Hiatt Kelly
Purchase Details
Closed on
Mar 8, 2016
Sold by
Philip Brandy
Bought by
Philip Brandy
Purchase Details
Closed on
Nov 10, 2004
Sold by
Philip Howard W
Bought by
Philip Howard W
Purchase Details
Closed on
Aug 29, 2003
Sold by
Roberts Herman Edgar
Bought by
Philip Howard W
Purchase Details
Closed on
Apr 23, 2002
Sold by
Theresa Roberts Mary and Edgar Herman
Bought by
Roberts Herman Edgar and Roberts Mary Theresa
Create a Home Valuation Report for This Property
The Home Valuation Report is an in-depth analysis detailing your home's value as well as a comparison with similar homes in the area
Home Values in the Area
Average Home Value in this Area
Purchase History
| Date | Buyer | Sale Price | Title Company |
|---|---|---|---|
| Manzo Pedro Vargas | $17,000 | None Available | |
| Okinbia Investment Propeilics Llc | $5,800 | None Available | |
| Thornton Christopher | $36,700 | -- | |
| Hiatt Kelly | $6,500 | Home Services Title Llc | |
| Philip Brandy | -- | None Available | |
| Philip Howard W | -- | None Available | |
| Philip Howard W | $31,000 | -- | |
| Roberts Herman Edgar | -- | -- |
Source: Public Records
Tax History Compared to Growth
Tax History
| Year | Tax Paid | Tax Assessment Tax Assessment Total Assessment is a certain percentage of the fair market value that is determined by local assessors to be the total taxable value of land and additions on the property. | Land | Improvement |
|---|---|---|---|---|
| 2024 | -- | $14,630 | $3,250 | $11,380 |
| 2023 | $0 | $14,630 | $3,250 | $11,380 |
| 2022 | $1,013 | $13,440 | $2,980 | $10,460 |
| 2021 | $1,008 | $13,440 | $2,980 | $10,460 |
| 2020 | $1,006 | $13,440 | $2,980 | $10,460 |
| 2019 | $1,327 | $11,840 | $2,980 | $8,860 |
| 2018 | $1,027 | $11,840 | $2,980 | $8,860 |
| 2017 | $977 | $11,840 | $2,980 | $8,860 |
| 2016 | $1,549 | $12,050 | $2,980 | $9,070 |
| 2015 | $987 | $12,050 | $2,980 | $9,070 |
| 2014 | $987 | $12,050 | $2,980 | $9,070 |
| 2012 | -- | $10,610 | $4,030 | $6,580 |
Source: Public Records
Map
Nearby Homes
- 2620 N Gettysburg Ave
- 2726 Wentworth Ave
- Lot#25 Glenbrook Dr
- 2512 England Ave
- Lot#1 Glenbrook Dr
- Lot#24 Glenbrook Dr
- Lot#21 Glenbrook Dr
- LOT#26 Glenbrook Dr
- 2212 Chamberlin Ave
- 3748 Saint James Ave
- 4651 Christopher Ave
- 4445 Prescott Ave
- Lot#14 Bridgeport Dr
- Lot#15 Bridgeport Dr
- 3801 Salem Ave
- 4541 Waymire Ave
- 3593 Saint James Ave
- 4054 Larkspur Dr
- 4725 W Hillcrest Ave
- 4637 Waymire Ave
- 2528 N Gettysburg Ave
- 2542 N Gettysburg Ave
- 2522 N Gettysburg Ave
- 2544 N Gettysburg Ave
- 2429 Grant Ave
- 2518 N Gettysburg Ave
- 2433 Grant Ave
- 2437 Grant Ave
- 2425 Grant Ave
- 2441 Grant Ave
- 4303 Owens Dr
- 2445 Grant Ave
- 2545 N Gettysburg Ave
- 4226 Gotham Ave
- 2451 Grant Ave
- 4309 Owens Dr
- 2432 Grant Ave
- 2436 Grant Ave
- 2420 Grant Ave
- 2600 N Gettysburg Ave