
Landlord's Agent in 2017
Gunnar Edelstein
Berkshire Hathaway Home Services
(203) 722-2551
6 in this area
10 Total Sales
Estimated Value: $835,000 - $2,160,000
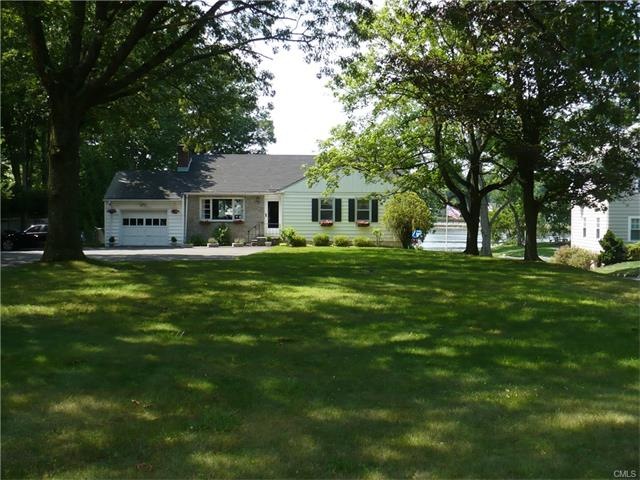
Waterfront home on Holly Pond. One or more year term. Tenant pays all utils, one month rent plus two months rent due at lease signing. Prefer non smoker. Pets considered. Access To Darien Town Beaches. Level Waterfront Property Set Back From The Road.
Last Agent to Rent the Property
BHHS Darien/New Canaan License #RES.0203154 Listed on: 07/01/2017
Last Renter's Agent
BHHS Darien/New Canaan License #RES.0203154 Listed on: 07/01/2017
| Date | Event | Price | List to Sale | Price per Sq Ft |
|---|---|---|---|---|
| 08/01/2017 08/01/17 | Rented | $3,500 | 0.0% | -- |
| 07/10/2017 07/10/17 | Under Contract | -- | -- | -- |
| 07/01/2017 07/01/17 | For Rent | $3,500 | +7.7% | -- |
| 12/16/2014 12/16/14 | Rented | $3,250 | -7.1% | -- |
| 11/16/2014 11/16/14 | Under Contract | -- | -- | -- |
| 08/12/2014 08/12/14 | For Rent | $3,500 | -- | -- |
| Year | Tax Paid | Tax Assessment Tax Assessment Total Assessment is a certain percentage of the fair market value that is determined by local assessors to be the total taxable value of land and additions on the property. | Land | Improvement |
|---|---|---|---|---|
| 2025 | $16,217 | $1,047,620 | $929,040 | $118,580 |
| 2024 | $15,390 | $1,047,620 | $929,040 | $118,580 |
| 2023 | $14,331 | $813,820 | $703,920 | $109,900 |
| 2022 | $14,022 | $813,820 | $703,920 | $109,900 |
| 2021 | $32,443 | $813,820 | $703,920 | $109,900 |
| 2020 | $13,314 | $813,820 | $703,920 | $109,900 |
| 2019 | $13,404 | $813,820 | $703,920 | $109,900 |
| 2018 | $16,764 | $1,042,510 | $928,760 | $113,750 |
| 2017 | $16,847 | $1,042,510 | $928,760 | $113,750 |
| 2016 | $16,440 | $1,042,510 | $928,760 | $113,750 |
| 2015 | $16,003 | $1,042,510 | $928,760 | $113,750 |
| 2014 | $15,648 | $1,042,510 | $928,760 | $113,750 |
Landlord's Agent in 2017
Gunnar Edelstein
Berkshire Hathaway Home Services
(203) 722-2551
6 in this area
10 Total Sales
Buyer's Agent in 2014
Mary Lynn Martin
William Raveis Real Estate
(203) 219-5444
2 Total Sales
Source: SmartMLS
MLS Number: 99191914
APN: DARI-000054-000000-000001
Disclaimer: Certain information contained herein is derived from information provided by parties other than Homes.com. All information provided is deemed reliable, but is not guaranteed to be accurate and should be independently verified.
![]() IDX information is provided exclusively for personal, non-commercial use, and may not be used for any purpose other than to identify prospective properties consumers may be interested in purchasing. Information is deemed reliable but not guaranteed.
IDX information is provided exclusively for personal, non-commercial use, and may not be used for any purpose other than to identify prospective properties consumers may be interested in purchasing. Information is deemed reliable but not guaranteed.
Ask me questions while you tour the home.