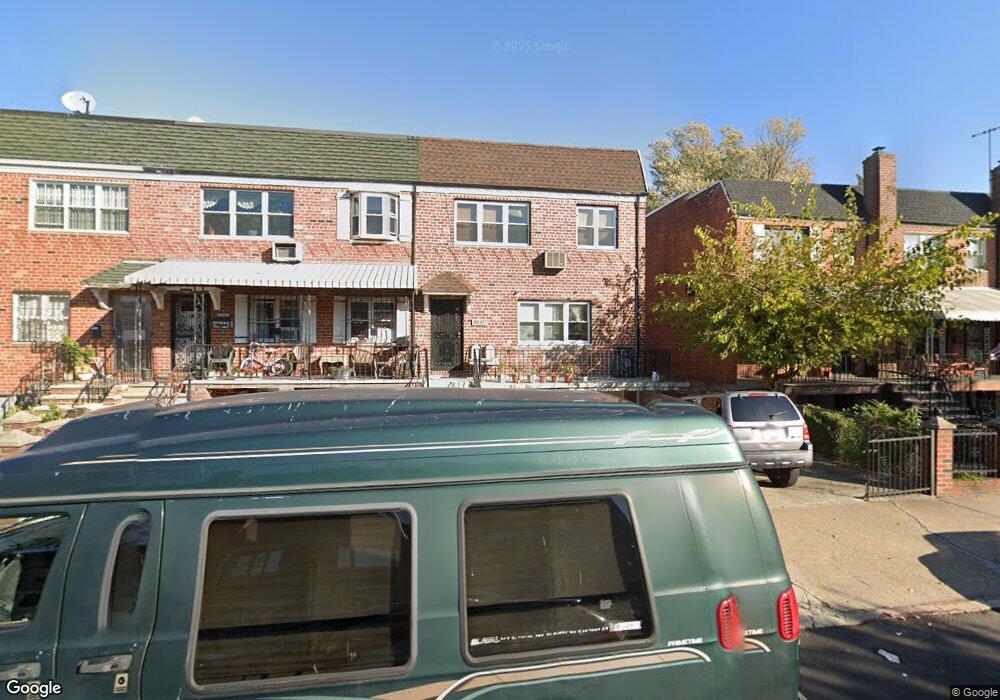
2537 81st St E. Elmhurst, NY 11370
Jackson Heights NeighborhoodEstimated Value: $1,033,000 - $1,296,000
3
Beds
1
Bath
2,964
Sq Ft
$400/Sq Ft
Est. Value
About This Home
This home is located at 2537 81st St, E. Elmhurst, NY 11370 and is currently estimated at $1,185,607, approximately $400 per square foot. 2537 81st St is a home located in Queens County with nearby schools including P.S. 2 Alfred Zimberg, Is 141 The Steinway, and William Cullen Bryant High School.
Ownership History
Date
Name
Owned For
Owner Type
Purchase Details
Closed on
Jul 27, 2021
Sold by
Kumari Krishna and Ram Parshan
Bought by
Kumar Rajinder and Kumar Vijay
Current Estimated Value
Purchase Details
Closed on
Sep 26, 2016
Sold by
Kumar Rajinder and Kumar Vijay
Bought by
Kumari Krishna and Ram Parshan
Purchase Details
Closed on
Aug 7, 2000
Sold by
Yu Pui Kin
Bought by
Kumar Rajinder and Kumar Vijay
Home Financials for this Owner
Home Financials are based on the most recent Mortgage that was taken out on this home.
Original Mortgage
$289,600
Interest Rate
8.1%
Create a Home Valuation Report for This Property
The Home Valuation Report is an in-depth analysis detailing your home's value as well as a comparison with similar homes in the area
Home Values in the Area
Average Home Value in this Area
Purchase History
| Date | Buyer | Sale Price | Title Company |
|---|---|---|---|
| Kumar Rajinder | -- | -- | |
| Kumari Krishna | -- | -- | |
| Kumar Rajinder | $362,000 | -- |
Source: Public Records
Mortgage History
| Date | Status | Borrower | Loan Amount |
|---|---|---|---|
| Previous Owner | Kumar Rajinder | $289,600 | |
| Closed | Kumar Rajinder | $36,200 |
Source: Public Records
Tax History
| Year | Tax Paid | Tax Assessment Tax Assessment Total Assessment is a certain percentage of the fair market value that is determined by local assessors to be the total taxable value of land and additions on the property. | Land | Improvement |
|---|---|---|---|---|
| 2025 | $10,999 | $56,160 | $7,551 | $48,609 |
| 2024 | $11,280 | $56,160 | $8,340 | $47,820 |
| 2023 | $10,525 | $53,803 | $6,775 | $47,028 |
| 2022 | $9,846 | $71,160 | $10,140 | $61,020 |
| 2021 | $10,144 | $76,140 | $10,140 | $66,000 |
| 2020 | $9,610 | $74,880 | $10,140 | $64,740 |
| 2019 | $9,497 | $72,180 | $10,140 | $62,040 |
| 2018 | $8,842 | $44,836 | $7,502 | $37,334 |
| 2017 | $8,323 | $42,301 | $8,060 | $34,241 |
| 2016 | $7,954 | $42,301 | $8,060 | $34,241 |
| 2015 | $4,593 | $39,000 | $11,280 | $27,720 |
| 2014 | $4,593 | $39,000 | $11,280 | $27,720 |
Source: Public Records
Map
Nearby Homes
Your Personal Tour Guide
Ask me questions while you tour the home.