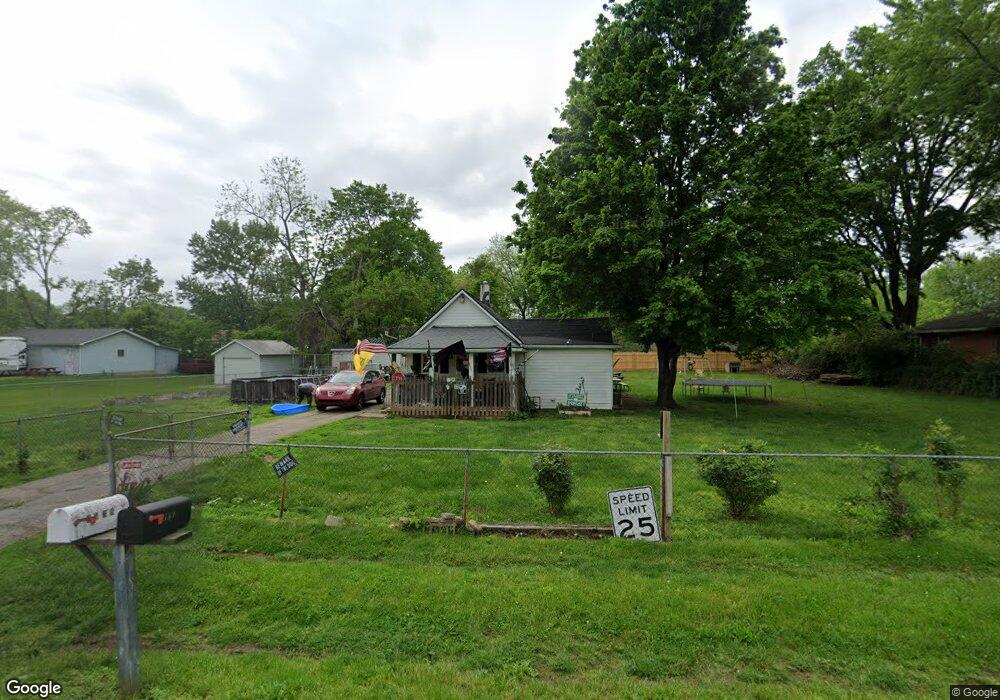
2537 Bushnell Ave Dayton, OH 45404
Avondale NeighborhoodEstimated Value: $49,000 - $95,000
2
Beds
1
Bath
1,008
Sq Ft
$71/Sq Ft
Est. Value
About This Home
This home is located at 2537 Bushnell Ave, Dayton, OH 45404 and is currently estimated at $72,000, approximately $71 per square foot. 2537 Bushnell Ave is a home located in Montgomery County with nearby schools including Stebbins High School, Pathway School of Discovery, and Liberty High School.
Ownership History
Date
Name
Owned For
Owner Type
Purchase Details
Closed on
Feb 23, 2011
Sold by
Us Bank N A
Bought by
Authorized Properties Llc
Current Estimated Value
Purchase Details
Closed on
Aug 3, 2010
Sold by
Secretary Of Veterans Affairs
Bought by
U S Bank Na
Purchase Details
Closed on
Jun 11, 2010
Sold by
Hurst Jerry Robert
Bought by
Secretary Of Veterans Affairs
Purchase Details
Closed on
Aug 1, 2005
Sold by
Fuerst Donald A and Fuerst Martin W
Bought by
Hurst Jerry Robert and Hurst Darleen A
Home Financials for this Owner
Home Financials are based on the most recent Mortgage that was taken out on this home.
Original Mortgage
$81,400
Interest Rate
5.71%
Mortgage Type
VA
Purchase Details
Closed on
Aug 26, 2002
Sold by
Stapleton Erma F
Bought by
Fuerst Donald A and Fuerst Martin W
Home Financials for this Owner
Home Financials are based on the most recent Mortgage that was taken out on this home.
Original Mortgage
$76,597
Interest Rate
6.41%
Mortgage Type
FHA
Create a Home Valuation Report for This Property
The Home Valuation Report is an in-depth analysis detailing your home's value as well as a comparison with similar homes in the area
Home Values in the Area
Average Home Value in this Area
Purchase History
| Date | Buyer | Sale Price | Title Company |
|---|---|---|---|
| Authorized Properties Llc | $12,000 | None Available | |
| U S Bank Na | -- | None Available | |
| Secretary Of Veterans Affairs | $16,000 | None Available | |
| Hurst Jerry Robert | $84,900 | -- | |
| Fuerst Donald A | $77,800 | -- |
Source: Public Records
Mortgage History
| Date | Status | Borrower | Loan Amount |
|---|---|---|---|
| Previous Owner | Hurst Jerry Robert | $81,400 | |
| Previous Owner | Fuerst Donald A | $76,597 |
Source: Public Records
Tax History Compared to Growth
Tax History
| Year | Tax Paid | Tax Assessment Tax Assessment Total Assessment is a certain percentage of the fair market value that is determined by local assessors to be the total taxable value of land and additions on the property. | Land | Improvement |
|---|---|---|---|---|
| 2024 | $211 | $4,060 | $3,370 | $690 |
| 2023 | $211 | $4,060 | $3,370 | $690 |
| 2022 | $225 | $3,250 | $2,700 | $550 |
| 2021 | $230 | $3,250 | $2,700 | $550 |
| 2020 | $229 | $3,250 | $2,700 | $550 |
| 2019 | $228 | $2,890 | $2,430 | $460 |
| 2018 | $228 | $2,890 | $2,430 | $460 |
| 2017 | $229 | $2,890 | $2,430 | $460 |
| 2016 | $256 | $3,160 | $2,700 | $460 |
| 2015 | $252 | $3,160 | $2,700 | $460 |
| 2014 | $252 | $3,160 | $2,700 | $460 |
| 2012 | -- | $3,210 | $2,700 | $510 |
Source: Public Records
Map
Nearby Homes
- 2460 Bushnell Ave
- -- Valley Pike
- - Valley Pike
- 2249 - Valley Pike
- 2301 Valley Pike
- 546 Wynora Ave
- 518 Tyron Ave
- - Prince Albert Blvd
- -- Prince Albert Blvd
- 2249 Prince Albert Blvd
- 2249 Valley Pike
- 641 Prince Albert Blvd
- 2245 Valley Pike
- 3586 Lane Garden Ct
- - Rondowa Ave
- -- Rondowa Ave
- 1930 Brandt Pike
- 241 Community Dr
- 29 Barcelona Ave
- 620 Homecrest Ave
- 2525 Bushnell Ave
- 2551 Bushnell Ave
- 2532 Guernsey Dell Ave
- 2519 Bushnell Ave
- 2536 Guernsey Dell Ave
- 2538 Guernsey Dell Ave
- 2517 Bushnell Ave
- 2534 Bushnell Ave
- 2518 Guernsey Dell Ave
- 2536 Bushnell Ave
- 2544 Guernsey Dell Ave
- 2530 Bushnell Ave
- 2544 Bushnell Ave
- 2555 Bushnell Ave
- 2515 Bushnell Ave
- 2548 Guernsey Dell Ave
- 2546 Bushnell Ave
- 2516 Guernsey Dell Ave
- 2548 Bushnell Ave
- 2524 Bushnell Ave