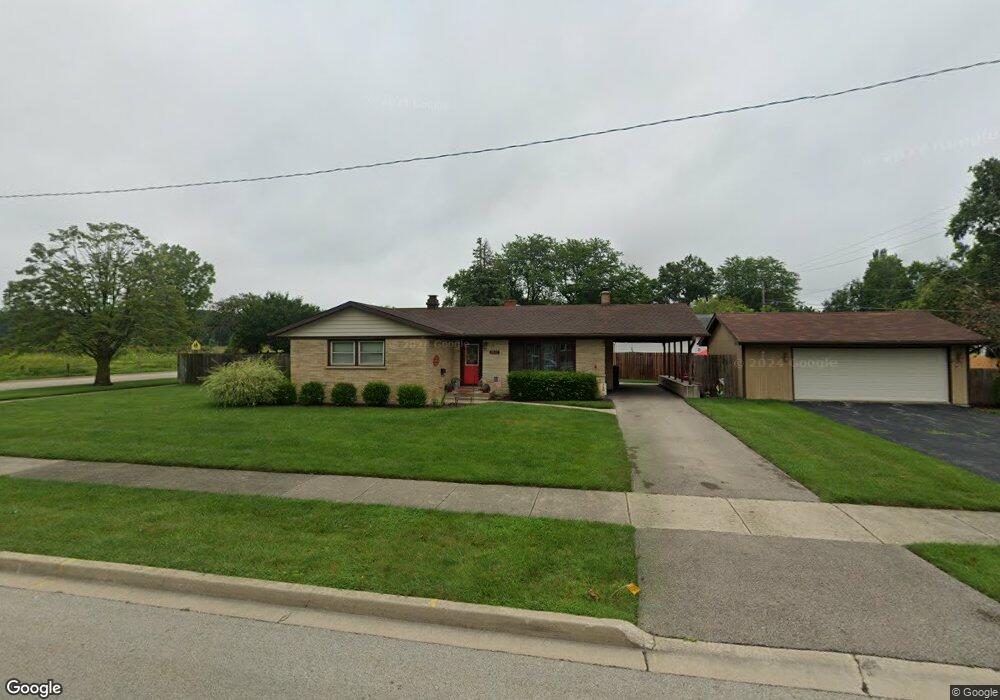
2537 Chestnut St Waukegan, IL 60087
Marquette Highlands NeighborhoodEstimated Value: $251,000 - $278,000
3
Beds
1
Bath
1,335
Sq Ft
$200/Sq Ft
Est. Value
About This Home
This home is located at 2537 Chestnut St, Waukegan, IL 60087 and is currently estimated at $266,583, approximately $199 per square foot. 2537 Chestnut St is a home located in Lake County with nearby schools including John S. Clark Elementary School, Jack Benny Middle School, and Waukegan High School.
Ownership History
Date
Name
Owned For
Owner Type
Purchase Details
Closed on
Jan 18, 2013
Sold by
Brown John C
Bought by
Brown Kathleen M
Current Estimated Value
Purchase Details
Closed on
Mar 28, 2003
Sold by
Bjorklund Robert G and Bjorklund Barbara L
Bought by
Brown John C and Brown Kathleen
Home Financials for this Owner
Home Financials are based on the most recent Mortgage that was taken out on this home.
Original Mortgage
$42,000
Interest Rate
6.02%
Purchase Details
Closed on
Sep 17, 2001
Sold by
Globis John T
Bought by
Bjorkland Robert G and Bjorkland Barbara L
Purchase Details
Closed on
Nov 10, 1997
Sold by
Allen Terry L
Bought by
Globis John T and Bjorkland Robert
Home Financials for this Owner
Home Financials are based on the most recent Mortgage that was taken out on this home.
Original Mortgage
$110,430
Interest Rate
7.43%
Mortgage Type
FHA
Create a Home Valuation Report for This Property
The Home Valuation Report is an in-depth analysis detailing your home's value as well as a comparison with similar homes in the area
Home Values in the Area
Average Home Value in this Area
Purchase History
| Date | Buyer | Sale Price | Title Company |
|---|---|---|---|
| Brown Kathleen M | -- | None Available | |
| Brown John C | $162,000 | First American Title Ins | |
| Bjorkland Robert G | -- | -- | |
| Globis John T | $85,333 | Chicago Title Insurance Co |
Source: Public Records
Mortgage History
| Date | Status | Borrower | Loan Amount |
|---|---|---|---|
| Closed | Brown John C | $42,000 | |
| Previous Owner | Globis John T | $110,430 |
Source: Public Records
Tax History Compared to Growth
Tax History
| Year | Tax Paid | Tax Assessment Tax Assessment Total Assessment is a certain percentage of the fair market value that is determined by local assessors to be the total taxable value of land and additions on the property. | Land | Improvement |
|---|---|---|---|---|
| 2024 | $3,695 | $78,719 | $19,087 | $59,632 |
| 2023 | $5,382 | $71,034 | $17,224 | $53,810 |
| 2022 | $5,382 | $66,051 | $16,036 | $50,015 |
| 2021 | $5,551 | $59,239 | $14,304 | $44,935 |
| 2020 | $5,576 | $55,188 | $13,326 | $41,862 |
| 2019 | $5,559 | $50,571 | $12,211 | $38,360 |
| 2018 | $5,386 | $48,041 | $17,282 | $30,759 |
| 2017 | $5,192 | $42,503 | $15,290 | $27,213 |
| 2016 | $4,780 | $36,933 | $13,286 | $23,647 |
| 2015 | $4,570 | $33,055 | $11,891 | $21,164 |
| 2014 | $5,415 | $37,545 | $10,608 | $26,937 |
| 2012 | $5,357 | $40,677 | $11,492 | $29,185 |
Source: Public Records
Map
Nearby Homes
- 301 W Eagle Ct
- 2232 Walnut St
- 0 Traditions Dr
- 1612 Whitney St
- 1636 Rice St
- 2613 N Lewis Ave
- 2246 Alta Vista Dr
- 2350 N Lewis Ave
- 2213 Alta Vista Dr
- 1905 Linden Ave
- 10241 W Bairstow Ave
- 37231 N Ganster Rd
- 37905 N Loyola Ave
- 616 W Keith Ave
- 38362 N Manor Ave
- 1018 W Atlantic Ave
- 38127 N Shore Ave
- 37966 N Cornell Rd
- 37789 N Sheridan Rd
- 3211 Rugby Ct
- 733 Blanchard Rd
- 2531 Chestnut St
- 2527 Chestnut St
- 2536 N Poplar St
- 2544 Chestnut St
- 2532 N Poplar St
- 2532 Chestnut St
- 2523 Chestnut St
- 2528 N Poplar St
- 2528 Chestnut St
- 2519 Chestnut St
- 2524 N Poplar St
- 2524 Chestnut St
- 2535 N Jackson St
- 2541 N Jackson St
- 2531 N Jackson St
- 2515 Chestnut St
- 2520 Chestnut St
- 2527 N Jackson St