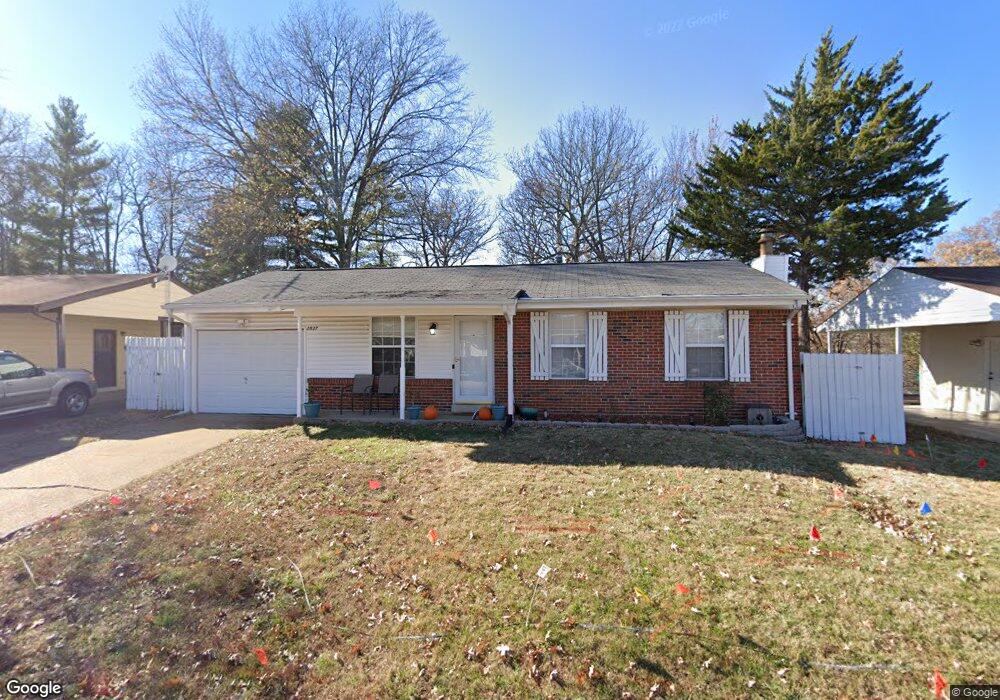
2537 Somerville Dr High Ridge, MO 63049
Estimated Value: $159,000 - $214,743
3
Beds
2
Baths
864
Sq Ft
$224/Sq Ft
Est. Value
About This Home
This home is located at 2537 Somerville Dr, High Ridge, MO 63049 and is currently estimated at $193,936, approximately $224 per square foot. 2537 Somerville Dr is a home located in Jefferson County with nearby schools including Northwest High School and St. Anthony School.
Ownership History
Date
Name
Owned For
Owner Type
Purchase Details
Closed on
Dec 27, 2011
Sold by
Mcleroy Geary K and Mcleroy Colleen E
Bought by
Beck Shane A and Beck Laura
Current Estimated Value
Home Financials for this Owner
Home Financials are based on the most recent Mortgage that was taken out on this home.
Original Mortgage
$59,000
Outstanding Balance
$40,244
Interest Rate
3.95%
Mortgage Type
Purchase Money Mortgage
Estimated Equity
$153,692
Purchase Details
Closed on
May 30, 2008
Sold by
Lichtenberg Stephen A and Lichtenberg Traci L
Bought by
Mcleroy Colleen E and Mcleroy Geary
Home Financials for this Owner
Home Financials are based on the most recent Mortgage that was taken out on this home.
Original Mortgage
$128,881
Interest Rate
6.07%
Mortgage Type
FHA
Purchase Details
Closed on
Mar 18, 2005
Sold by
Menees Marta R and Menees Ralph V
Bought by
Lichtenberg Stephen A and Hopkins Traci L
Home Financials for this Owner
Home Financials are based on the most recent Mortgage that was taken out on this home.
Original Mortgage
$99,100
Interest Rate
5.67%
Mortgage Type
Purchase Money Mortgage
Purchase Details
Closed on
May 10, 1999
Sold by
Menees Ralph V
Bought by
Menees Marta R
Create a Home Valuation Report for This Property
The Home Valuation Report is an in-depth analysis detailing your home's value as well as a comparison with similar homes in the area
Home Values in the Area
Average Home Value in this Area
Purchase History
| Date | Buyer | Sale Price | Title Company |
|---|---|---|---|
| Beck Shane A | -- | Assured Title Company | |
| Mcleroy Colleen E | -- | Ust | |
| Lichtenberg Stephen A | -- | Old Republic Title Company | |
| Menees Marta R | -- | -- |
Source: Public Records
Mortgage History
| Date | Status | Borrower | Loan Amount |
|---|---|---|---|
| Open | Beck Shane A | $59,000 | |
| Previous Owner | Mcleroy Colleen E | $128,881 | |
| Previous Owner | Lichtenberg Stephen A | $99,100 |
Source: Public Records
Tax History Compared to Growth
Tax History
| Year | Tax Paid | Tax Assessment Tax Assessment Total Assessment is a certain percentage of the fair market value that is determined by local assessors to be the total taxable value of land and additions on the property. | Land | Improvement |
|---|---|---|---|---|
| 2025 | $1,264 | $18,500 | $2,500 | $16,000 |
| 2024 | $1,264 | $17,500 | $2,500 | $15,000 |
| 2023 | $1,264 | $17,500 | $2,500 | $15,000 |
| 2022 | $1,258 | $17,500 | $2,500 | $15,000 |
| 2021 | $1,250 | $17,500 | $2,500 | $15,000 |
| 2020 | $1,142 | $15,600 | $2,100 | $13,500 |
| 2019 | $1,140 | $15,600 | $2,100 | $13,500 |
| 2018 | $1,155 | $15,600 | $2,100 | $13,500 |
| 2017 | $1,056 | $15,600 | $2,100 | $13,500 |
| 2016 | $969 | $14,200 | $2,100 | $12,100 |
| 2015 | $996 | $14,200 | $2,100 | $12,100 |
| 2013 | -- | $13,600 | $2,100 | $11,500 |
Source: Public Records
Map
Nearby Homes
- 5340 Winthrop Dr
- 2436 Hillsboro Valley Park Rd
- 5340 Gloucester Rd
- 2705 Cathy Ann Dr
- 0 3 Lot Blk 2 High Ridge Manor Unit MAR24044893
- 2341 Gloucester Rd
- TBD State Route 30
- 152 Brandy Mill Cir Unit 9G
- 2801 High Ridge Blvd
- 168 Brandy Mill Cir Unit 5B
- 5707 Werner Dr
- 172 Brandy Mill Cir Unit 4D
- 5324 Brinridge Dr
- 2149 Linnus Dr
- 2135 Linnus Dr
- 2909 Hilgert Dr
- 3008 High Ridge Dr
- 2905 Carol Ln
- 2908 Elderwood Cir
- 2145 Freckles Dr
- 2537 Somerville Dr
- 2533 Somerville Dr
- 2541 Somerville Dr
- 2529 Somerville Dr
- 2545 Somerville Dr
- 2536 Somerville Dr
- 2540 Somerville Dr
- 2532 Somerville Dr
- 2544 Somerville Dr
- 2549 Somerville Dr
- 2525 Somerville Dr
- 2528 Somerville Dr
- 2508 Skyline Dr
- 2548 Somerville Dr
- 2553 Somerville Dr
- 2529 Woburn Dr
- 2525 Woburn Dr
- 2533 Woburn Dr
- 2512 Skyline Dr
- 2521 Woburn Dr