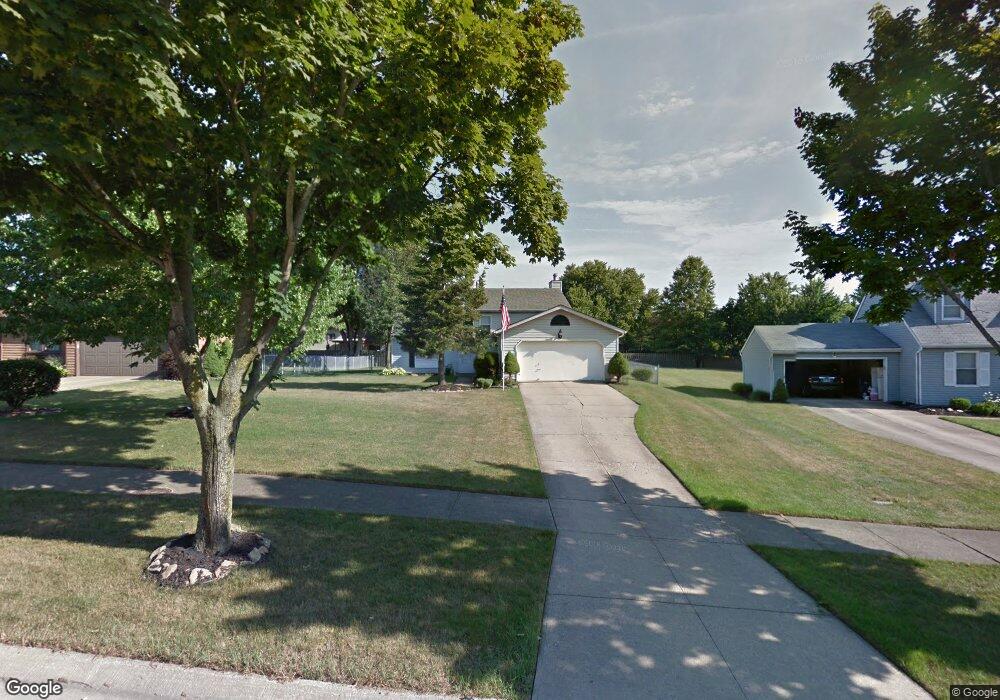
25378 Tyndall Falls Dr Olmsted Falls, OH 44138
Estimated Value: $291,000 - $347,000
3
Beds
2
Baths
2,104
Sq Ft
$147/Sq Ft
Est. Value
About This Home
This home is located at 25378 Tyndall Falls Dr, Olmsted Falls, OH 44138 and is currently estimated at $309,233, approximately $146 per square foot. 25378 Tyndall Falls Dr is a home located in Cuyahoga County with nearby schools including Falls-Lenox Primary Elementary School, Olmsted Falls Intermediate Building, and Olmsted Falls Middle School.
Ownership History
Date
Name
Owned For
Owner Type
Purchase Details
Closed on
Oct 7, 1998
Sold by
Girfiths David P and Girfiths Kim J
Bought by
Lapohn Laura A
Current Estimated Value
Home Financials for this Owner
Home Financials are based on the most recent Mortgage that was taken out on this home.
Original Mortgage
$99,500
Outstanding Balance
$21,785
Interest Rate
6.9%
Estimated Equity
$287,448
Purchase Details
Closed on
Sep 27, 1984
Bought by
Girfiths David P and Girfiths Kim J
Purchase Details
Closed on
Jan 4, 1983
Bought by
First Fed S&L Bank
Purchase Details
Closed on
Jan 1, 1981
Bought by
Gibson Partners Inc
Create a Home Valuation Report for This Property
The Home Valuation Report is an in-depth analysis detailing your home's value as well as a comparison with similar homes in the area
Home Values in the Area
Average Home Value in this Area
Purchase History
| Date | Buyer | Sale Price | Title Company |
|---|---|---|---|
| Lapohn Laura A | $124,500 | Chicago Title Insurance Comp | |
| Girfiths David P | $75,700 | -- | |
| Shore West Construction Co | $14,900 | -- | |
| First Fed S&L Bank | -- | -- | |
| Gibson Partners Inc | -- | -- |
Source: Public Records
Mortgage History
| Date | Status | Borrower | Loan Amount |
|---|---|---|---|
| Open | Lapohn Laura A | $99,500 |
Source: Public Records
Tax History Compared to Growth
Tax History
| Year | Tax Paid | Tax Assessment Tax Assessment Total Assessment is a certain percentage of the fair market value that is determined by local assessors to be the total taxable value of land and additions on the property. | Land | Improvement |
|---|---|---|---|---|
| 2024 | $5,778 | $88,620 | $19,810 | $68,810 |
| 2023 | $4,952 | $61,920 | $18,310 | $43,610 |
| 2022 | $4,911 | $61,915 | $18,305 | $43,610 |
| 2021 | $4,862 | $61,920 | $18,310 | $43,610 |
| 2020 | $4,800 | $54,320 | $16,070 | $38,260 |
| 2019 | $4,261 | $155,200 | $45,900 | $109,300 |
| 2018 | $4,296 | $54,320 | $16,070 | $38,260 |
| 2017 | $4,309 | $50,860 | $15,720 | $35,140 |
| 2016 | $4,286 | $50,860 | $15,720 | $35,140 |
| 2015 | $4,488 | $50,860 | $15,720 | $35,140 |
| 2014 | $4,488 | $49,950 | $14,840 | $35,110 |
Source: Public Records
Map
Nearby Homes
- 9190 Waterfall Dr
- 9180 Waterfall Dr
- 9430 Columbia Rd
- 24628 Sprague Rd
- Caroline Plan at Falls Landing - Villas
- Wexford Plan at Falls Landing - Villas
- Rosecliff Plan at Falls Landing - Villas
- 26179 Raintree Blvd Unit D8
- Anderson Plan at Smokestack Trails
- Bramante Ranch Plan at Smokestack Trails
- Hudson Plan at Smokestack Trails
- Columbia Plan at Smokestack Trails
- Lehigh Plan at Smokestack Trails
- 9855 Dupont Dr
- 26187 Raintree Blvd Unit C5
- 26183 Raintree Blvd Unit C-10
- 9947 Magnolia Dr Unit 14
- V/L Aldridge Dr
- 26511 Locust Dr
- 26523 Sussex Dr
- 25382 Tyndall Falls Dr
- 25374 Tyndall Falls Dr
- 9525 Charney Cir
- 25386 Tyndall Falls Dr
- 25370 Tyndall Falls Dr
- 25381 Tyndall Falls Dr
- 9534 Glencairn Ln
- 9529 Charney Cir
- 25377 Tyndall Falls Dr
- 9517 Charney Cir
- 25366 Tyndall Falls Dr
- 9530 Glencairn Ln
- 9533 Charney Cir
- 25373 Tyndall Falls Dr
- 25389 Tyndall Falls Dr
- 25394 Tyndall Falls Dr
- 25369 Tyndall Falls Dr
- 9508 Charney Cir
- 9537 Charney Cir
- 9527 Glencairn Ln