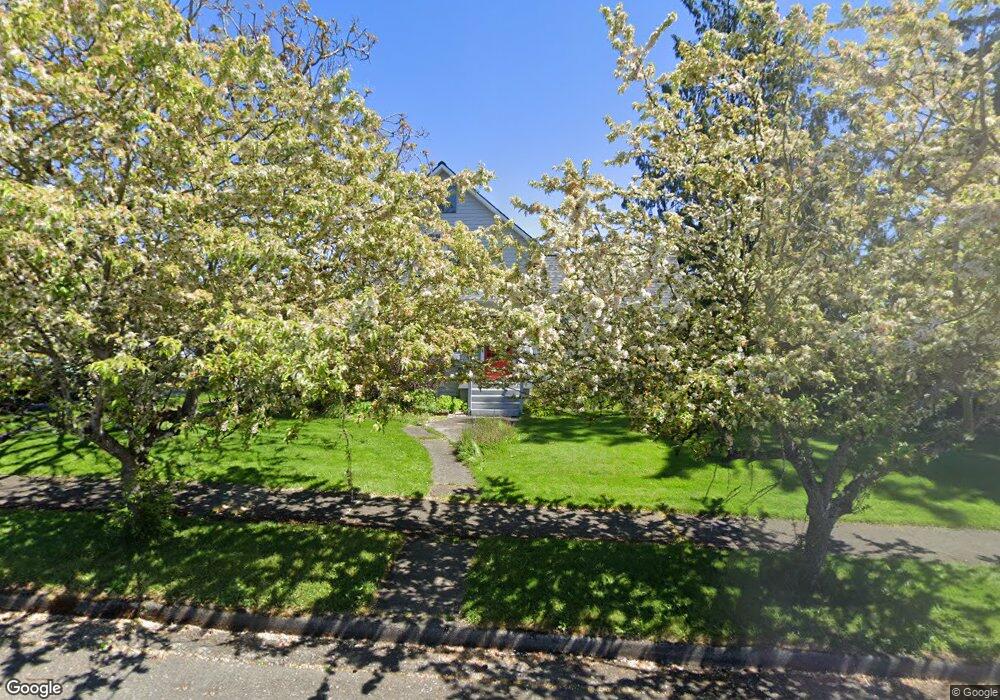
2538 Grant St Bellingham, WA 98225
Sunnyland NeighborhoodEstimated Value: $758,000 - $851,000
4
Beds
2
Baths
1,652
Sq Ft
$482/Sq Ft
Est. Value
About This Home
This home is located at 2538 Grant St, Bellingham, WA 98225 and is currently estimated at $796,299, approximately $482 per square foot. 2538 Grant St is a home located in Whatcom County with nearby schools including Sunnyland Elementary School, Whatcom Middle School, and Bellingham High School.
Ownership History
Date
Name
Owned For
Owner Type
Purchase Details
Closed on
Jun 6, 2003
Sold by
Wichers Shane A and Wichers Kimberly A
Bought by
Cassidy Brian R and Cassidy Lisa L
Current Estimated Value
Home Financials for this Owner
Home Financials are based on the most recent Mortgage that was taken out on this home.
Original Mortgage
$162,800
Outstanding Balance
$70,434
Interest Rate
5.61%
Mortgage Type
Purchase Money Mortgage
Estimated Equity
$725,865
Create a Home Valuation Report for This Property
The Home Valuation Report is an in-depth analysis detailing your home's value as well as a comparison with similar homes in the area
Home Values in the Area
Average Home Value in this Area
Purchase History
| Date | Buyer | Sale Price | Title Company |
|---|---|---|---|
| Cassidy Brian R | $203,500 | Whatcom Land Title |
Source: Public Records
Mortgage History
| Date | Status | Borrower | Loan Amount |
|---|---|---|---|
| Open | Cassidy Brian R | $162,800 | |
| Closed | Cassidy Brian R | $20,350 |
Source: Public Records
Tax History Compared to Growth
Tax History
| Year | Tax Paid | Tax Assessment Tax Assessment Total Assessment is a certain percentage of the fair market value that is determined by local assessors to be the total taxable value of land and additions on the property. | Land | Improvement |
|---|---|---|---|---|
| 2024 | $6,088 | $762,949 | $307,880 | $455,069 |
| 2023 | $6,088 | $782,329 | $315,700 | $466,629 |
| 2022 | $4,983 | $674,432 | $272,160 | $402,272 |
| 2021 | $4,459 | $536,442 | $216,000 | $320,442 |
| 2020 | $3,937 | $453,074 | $200,000 | $253,074 |
| 2019 | $3,525 | $386,689 | $196,317 | $190,372 |
| 2018 | $3,550 | $347,121 | $176,257 | $170,864 |
| 2017 | $3,059 | $298,859 | $151,748 | $147,111 |
| 2016 | $2,678 | $269,168 | $136,172 | $132,996 |
| 2015 | $2,626 | $245,320 | $124,372 | $120,948 |
| 2014 | -- | $232,751 | $118,000 | $114,751 |
| 2013 | -- | $237,303 | $120,750 | $116,553 |
Source: Public Records
Map
Nearby Homes
- 2530 Grant St
- 2526 Grant St
- 503 E North St
- 518 E North St
- 501 E North St
- 511 E North St
- 2520 Grant St
- 2527 Humboldt St
- 2531 Grant St
- 2525 Humboldt St
- 517 E North St
- 520 E North St
- 2521 Humboldt St
- 2514 Grant St
- 2529 Grant St
- 423 E North St
- 521 E North St
- 2525 Grant St
- 2517 Humboldt St
- 412 E North St