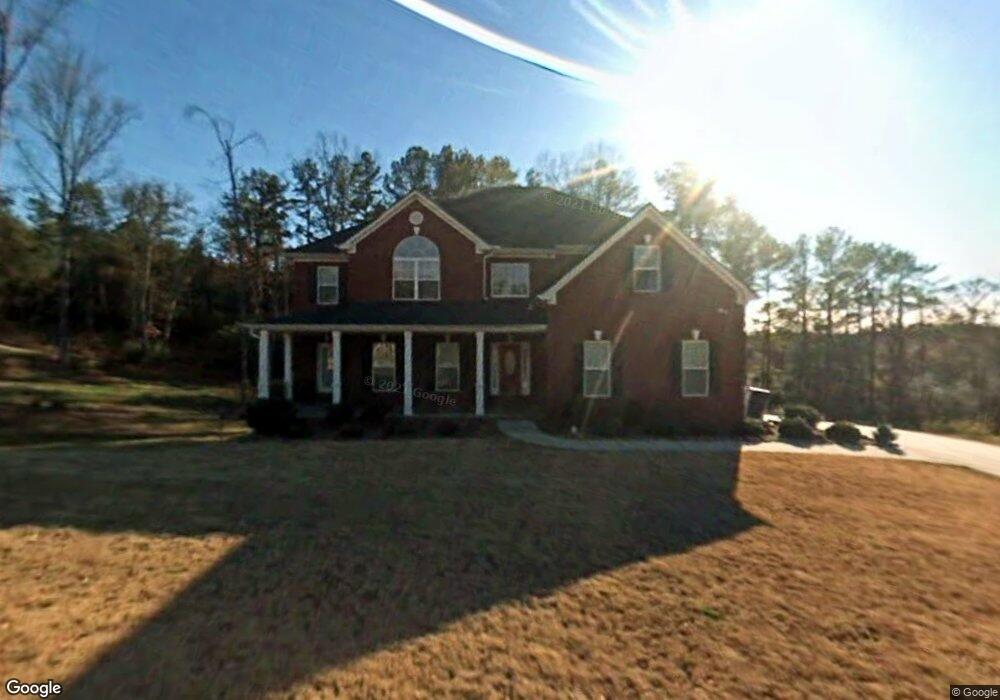
2538 Hope Dr Unit 2 Conyers, GA 30094
Estimated Value: $469,443 - $623,000
5
Beds
3
Baths
3,378
Sq Ft
$160/Sq Ft
Est. Value
About This Home
This home is located at 2538 Hope Dr Unit 2, Conyers, GA 30094 and is currently estimated at $540,361, approximately $159 per square foot. 2538 Hope Dr Unit 2 is a home located in Rockdale County with nearby schools including Sims Elementary School, Edwards Middle School, and Heritage High School.
Ownership History
Date
Name
Owned For
Owner Type
Purchase Details
Closed on
Jul 30, 2021
Sold by
Jenkins Charles
Bought by
Jenkins Neisa R
Current Estimated Value
Purchase Details
Closed on
Dec 20, 2004
Sold by
Jenkins Neisa R
Bought by
Jenkins Neisa R and Jenkins Charles
Home Financials for this Owner
Home Financials are based on the most recent Mortgage that was taken out on this home.
Original Mortgage
$247,920
Interest Rate
6%
Mortgage Type
New Conventional
Purchase Details
Closed on
Aug 27, 2004
Sold by
Roma Props Inc
Bought by
Bonner Bldrs Inc
Create a Home Valuation Report for This Property
The Home Valuation Report is an in-depth analysis detailing your home's value as well as a comparison with similar homes in the area
Home Values in the Area
Average Home Value in this Area
Purchase History
| Date | Buyer | Sale Price | Title Company |
|---|---|---|---|
| Jenkins Neisa R | -- | -- | |
| Jenkins Neisa R | -- | -- | |
| Jenkins Neisha R | $309,900 | -- | |
| Bonner Bldrs Inc | -- | -- |
Source: Public Records
Mortgage History
| Date | Status | Borrower | Loan Amount |
|---|---|---|---|
| Previous Owner | Jenkins Neisha R | $247,920 | |
| Previous Owner | Jenkins Neisha R | $61,980 |
Source: Public Records
Tax History Compared to Growth
Tax History
| Year | Tax Paid | Tax Assessment Tax Assessment Total Assessment is a certain percentage of the fair market value that is determined by local assessors to be the total taxable value of land and additions on the property. | Land | Improvement |
|---|---|---|---|---|
| 2024 | $5,580 | $218,680 | $36,440 | $182,240 |
| 2023 | $4,727 | $192,680 | $36,440 | $156,240 |
| 2022 | $3,545 | $146,600 | $28,000 | $118,600 |
| 2021 | $1,427 | $146,600 | $28,000 | $118,600 |
| 2020 | $1,556 | $140,280 | $21,680 | $118,600 |
| 2019 | $1,125 | $120,280 | $15,840 | $104,440 |
| 2018 | $1,210 | $118,240 | $13,800 | $104,440 |
| 2017 | $1,098 | $110,640 | $13,200 | $97,440 |
| 2016 | $1,119 | $107,720 | $12,000 | $95,720 |
| 2015 | $1,133 | $107,720 | $12,000 | $95,720 |
| 2014 | $1,155 | $107,720 | $12,000 | $95,720 |
| 2013 | -- | $117,800 | $18,000 | $99,800 |
Source: Public Records
Map
Nearby Homes
- 2402 Highway 138 SW
- 2352 Highway 138 SW
- 3412 Kinsley Ct
- 2630 Hwy 138
- 2340 New Haven Place Unit 3
- 309 Cedar Hollow Dr
- 2329 Lochinver Ln SW
- 2150 Smyrna Ridge Ct SW
- 2325 Lochinver Ln SW
- 321 Yukon Dr Unit 68
- 403 Whitehorse Way Unit 41
- 327 Yukon Dr Unit 65
- 339 Yukon Dr Unit 59
- 329 Yukon Dr Unit 64
- 2704 Forest Park Ct Unit 1
- 2315 Lochinver Ln SW
- 3284 Creekside Dr SE
- 2534 Hope Dr Unit 2
- 2542 Hope Dr Unit 2
- 2539 Hope Dr
- 2535 Hope Dr SW
- 2543 Hope Dr Unit 13
- 2543 Hope Dr
- 2609 Faith Ct
- 2535 Hope Dr Unit 2
- 2543 Hope Dr SW
- 2524 Hope Dr
- 2605 Faith Ct Unit 28
- 2605 Faith Ct
- 2546 Hope Dr
- 2603 Faith Ct Unit 1
- 2547 Hope Dr
- 2611 Faith Ct
- 2531 Hope Dr SW Unit 10
- 2508 Hope Dr
- 2508 Hope Dr Unit 2508
- 2531 Hope Dr