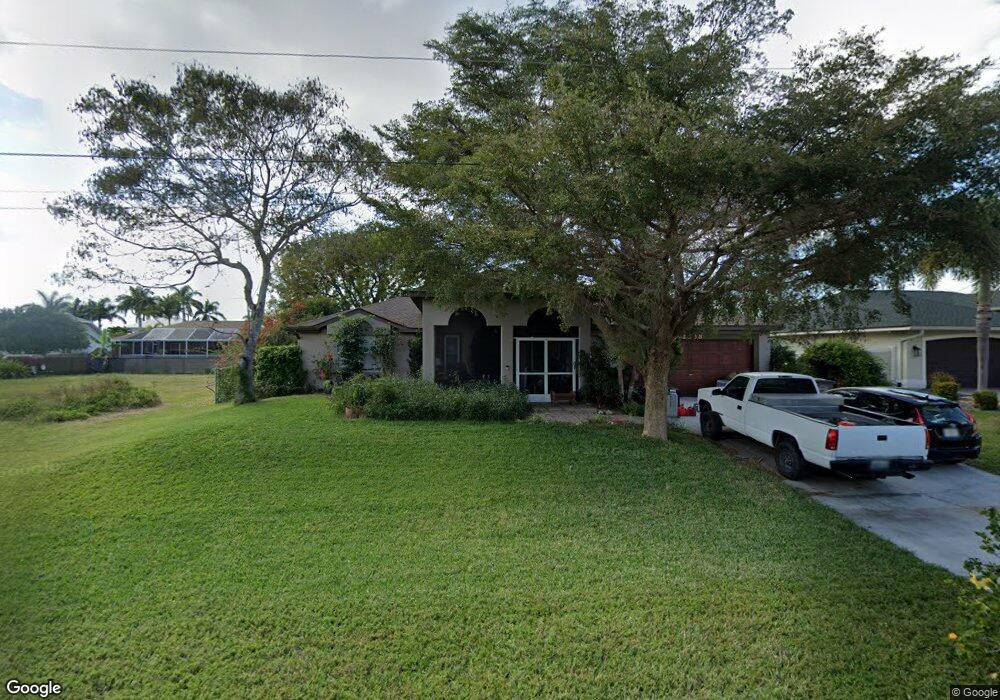
2538 SW 27th Ave Unit 93 Cape Coral, FL 33914
Pelican NeighborhoodEstimated Value: $280,000 - $425,000
3
Beds
2
Baths
1,898
Sq Ft
$190/Sq Ft
Est. Value
About This Home
This home is located at 2538 SW 27th Ave Unit 93, Cape Coral, FL 33914 and is currently estimated at $360,970, approximately $190 per square foot. 2538 SW 27th Ave Unit 93 is a home located in Lee County with nearby schools including Cape Elementary School, Caloosa Elementary School, and Tropic Isles Elementary School.
Ownership History
Date
Name
Owned For
Owner Type
Purchase Details
Closed on
Feb 28, 2018
Sold by
Salerno Paul and Salerno Louise
Bought by
Salerno Paul
Current Estimated Value
Purchase Details
Closed on
Mar 4, 2011
Sold by
Fannie Mae
Bought by
Salerno Paul and Salerno Louise
Purchase Details
Closed on
Sep 28, 2010
Sold by
Bilyeu Richard Layne and Bilyeu Richard L
Bought by
Federal National Mortgage Association
Purchase Details
Closed on
Jul 16, 2008
Sold by
Bilyeu Leisa J
Bought by
Bilyeu Richard L
Purchase Details
Closed on
Jan 28, 1994
Sold by
Olson Jaedyne Ann
Bought by
Bilyeu Richard Layne and Bilyeu Leisa Jill
Home Financials for this Owner
Home Financials are based on the most recent Mortgage that was taken out on this home.
Original Mortgage
$74,500
Interest Rate
7.1%
Create a Home Valuation Report for This Property
The Home Valuation Report is an in-depth analysis detailing your home's value as well as a comparison with similar homes in the area
Home Values in the Area
Average Home Value in this Area
Purchase History
| Date | Buyer | Sale Price | Title Company |
|---|---|---|---|
| Salerno Paul | -- | Attorney | |
| Salerno Paul | $79,500 | Title & Abstract Agency Of A | |
| Federal National Mortgage Association | -- | None Available | |
| Bilyeu Richard L | $83,500 | None Available | |
| Bilyeu Richard Layne | $78,500 | -- |
Source: Public Records
Mortgage History
| Date | Status | Borrower | Loan Amount |
|---|---|---|---|
| Previous Owner | Bilyeu Richard Layne | $74,500 |
Source: Public Records
Tax History Compared to Growth
Tax History
| Year | Tax Paid | Tax Assessment Tax Assessment Total Assessment is a certain percentage of the fair market value that is determined by local assessors to be the total taxable value of land and additions on the property. | Land | Improvement |
|---|---|---|---|---|
| 2025 | $3,215 | $135,192 | -- | -- |
| 2024 | $3,108 | $131,382 | -- | -- |
| 2023 | $3,108 | $127,555 | $0 | $0 |
| 2022 | $2,932 | $123,840 | $0 | $0 |
| 2021 | $2,891 | $187,472 | $44,616 | $142,856 |
| 2020 | $2,773 | $118,573 | $0 | $0 |
| 2019 | $2,358 | $97,717 | $0 | $0 |
| 2018 | $2,341 | $95,895 | $0 | $0 |
| 2017 | $2,328 | $93,923 | $0 | $0 |
| 2016 | $2,314 | $130,503 | $29,359 | $101,144 |
| 2015 | $2,298 | $108,689 | $21,755 | $86,934 |
| 2014 | $2,340 | $104,495 | $19,719 | $84,776 |
| 2013 | -- | $96,096 | $10,253 | $85,843 |
Source: Public Records
Map
Nearby Homes
- 2531 SW 27th Ave
- 2532 SW 26th Place
- 2525 SW 27th Place
- 2548 SW 26th Place
- 2563 SW 27th Ave
- 2712 SW 25th St
- 2557 SW 27th Place
- 2709 SW 25th St
- 2602 SW 25th St Unit 29
- 2527 SW 25th Terrace
- 2733 SW 25th St
- 2580 SW 26th Terrace
- 2520 SW 25th St
- 2711 SW 27th St
- 2713 SW 28th Ave
- 2810 SW 25th St
- 2648 Somerville Loop Unit 1306
- 2536 SW 28th Place
- 2540 SW 28th Place
- 2510 Miracle Pkwy
- 2534 SW 27th Ave
- 2533 SW 27th Place
- 2546 SW 27th Ave
- 2541 SW 27th Place
- 2543 SW 27th Ave
- 2529 SW 27th Place
- 2535 SW 27th Ave
- 2545 SW 27th Place Unit 93
- 2547 SW 27th Ave
- 2526 SW 27th Ave
- 2550 SW 27th Ave
- 2551 SW 27th Ave
- 2549 SW 27th Place
- 2538 SW 27th Place
- 2542 SW 27th Place
- 2527 SW 27th Ave
- 2522 SW 27th Ave
- 2534 SW 27th Place
- 2554 SW 27th Ave
- 2546 SW 27th Place