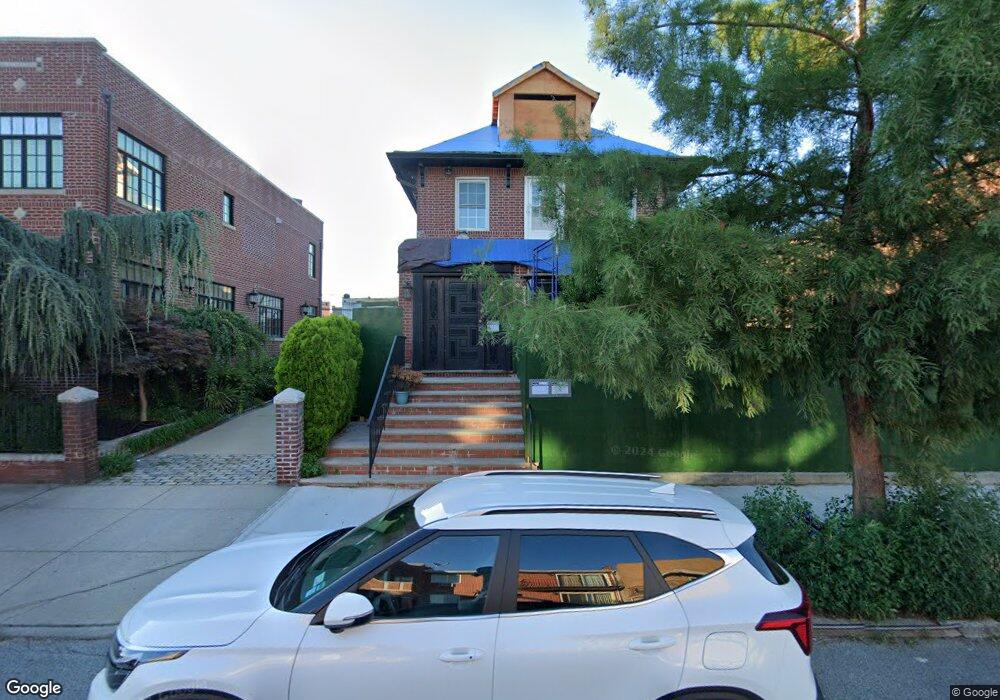
2539 41st St Astoria, NY 11103
Astoria NeighborhoodEstimated Value: $1,226,000 - $2,313,000
--
Bed
--
Bath
2,127
Sq Ft
$840/Sq Ft
Est. Value
About This Home
This home is located at 2539 41st St, Astoria, NY 11103 and is currently estimated at $1,787,732, approximately $840 per square foot. 2539 41st St is a home located in Queens County with nearby schools including P.S. 070Q, I.S. 010 Horace Greeley, and William Cullen Bryant High School.
Ownership History
Date
Name
Owned For
Owner Type
Purchase Details
Closed on
Mar 15, 2023
Sold by
25-39 41St Street Llc
Bought by
Brualdi Martha and Brualdi Richard
Current Estimated Value
Purchase Details
Closed on
Dec 21, 2017
Sold by
Debono Frank
Bought by
25-39 41St Street Llc
Purchase Details
Closed on
Jan 30, 2015
Sold by
Stevkovski Oriana
Bought by
Debono Frank
Home Financials for this Owner
Home Financials are based on the most recent Mortgage that was taken out on this home.
Original Mortgage
$1,000,000
Interest Rate
3.66%
Mortgage Type
Purchase Money Mortgage
Purchase Details
Closed on
Apr 28, 2006
Sold by
Mari Laura
Bought by
Stevkovski Mile and Stevkovski Oriana
Home Financials for this Owner
Home Financials are based on the most recent Mortgage that was taken out on this home.
Original Mortgage
$200,000
Interest Rate
6.4%
Purchase Details
Closed on
Dec 30, 1999
Sold by
Mari Daniel and Mari Laura
Bought by
Mari Laura
Create a Home Valuation Report for This Property
The Home Valuation Report is an in-depth analysis detailing your home's value as well as a comparison with similar homes in the area
Home Values in the Area
Average Home Value in this Area
Purchase History
| Date | Buyer | Sale Price | Title Company |
|---|---|---|---|
| Brualdi Martha | $2,250,000 | -- | |
| Brualdi Martha | $2,250,000 | -- | |
| 25-39 41St Street Llc | -- | -- | |
| 25-39 41St Street Llc | -- | -- | |
| Debono Frank | $1,700,000 | -- | |
| Debono Frank | $1,700,000 | -- | |
| Stevkovski Mile | $1,375,000 | -- | |
| Stevkovski Mile | $1,375,000 | -- | |
| Mari Laura | -- | -- | |
| Mari Laura | -- | -- |
Source: Public Records
Mortgage History
| Date | Status | Borrower | Loan Amount |
|---|---|---|---|
| Previous Owner | Debono Frank | $1,000,000 | |
| Previous Owner | Stevkovski Mile | $200,000 | |
| Previous Owner | Stevkovski Mile | $650,000 |
Source: Public Records
Tax History Compared to Growth
Tax History
| Year | Tax Paid | Tax Assessment Tax Assessment Total Assessment is a certain percentage of the fair market value that is determined by local assessors to be the total taxable value of land and additions on the property. | Land | Improvement |
|---|---|---|---|---|
| 2025 | $12,674 | $66,887 | $17,859 | $49,028 |
| 2024 | $12,674 | $63,102 | $17,810 | $45,292 |
| 2023 | $12,154 | $60,514 | $18,923 | $41,591 |
| 2022 | $12,080 | $90,600 | $28,500 | $62,100 |
| 2021 | $12,434 | $86,820 | $28,500 | $58,320 |
| 2020 | $11,798 | $94,800 | $28,500 | $66,300 |
| 2019 | $11,000 | $104,400 | $28,500 | $75,900 |
| 2018 | $10,280 | $50,428 | $11,776 | $38,652 |
| 2017 | $10,280 | $50,428 | $13,830 | $36,598 |
| 2016 | $9,842 | $50,428 | $13,830 | $36,598 |
| 2015 | $5,738 | $46,449 | $16,078 | $30,371 |
| 2014 | $5,738 | $43,821 | $18,209 | $25,612 |
Source: Public Records
Map
Nearby Homes
- 25-34 42nd St
- 2549 42nd St
- 25-14 43rd St
- 25-47 Steinway St
- 25-14 44th St
- 43-16 25th Ave
- 24-75 38th St Unit C3
- 24-75 38th St Unit A1
- 24-75 38th St Unit 5C
- 24-75 38th St Unit C9
- 24-75 38th St Unit A10
- 24-65 38 St Unit D10
- 24-65 38th St Unit D4
- 24-65 38th St Unit A5
- 25-63 38th St Unit 1A
- 2451 38th St Unit 7B
- 24-51 38th St Unit B7
- 2569 38th St Unit 1R
- 24-39 38th St Unit B7B8
- 25-64 38th St