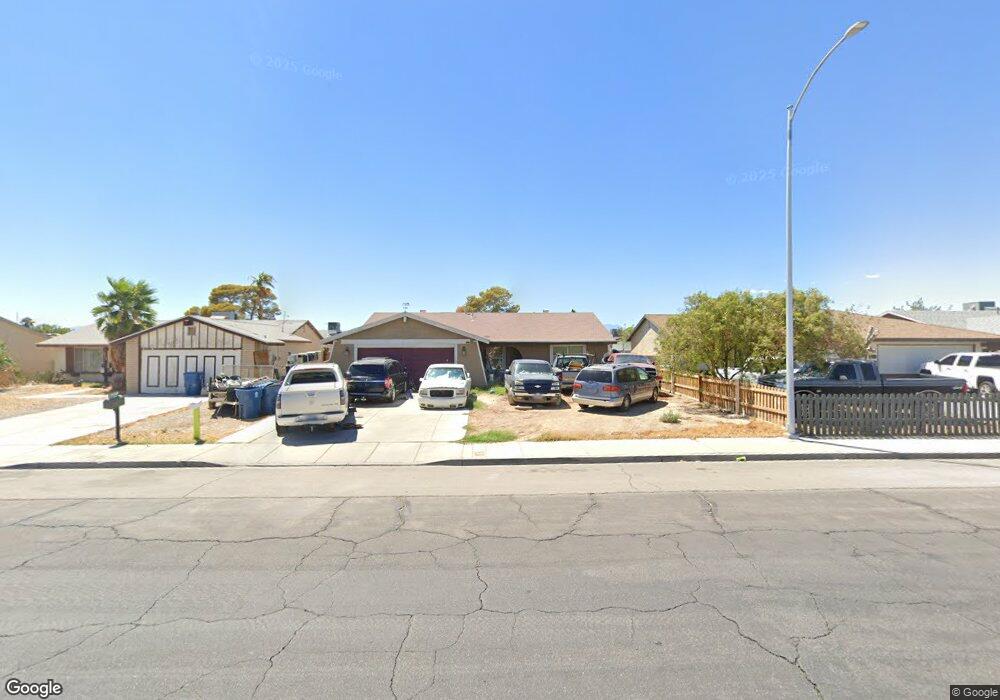
2539 N Walnut Rd Las Vegas, NV 89115
Estimated Value: $301,000 - $398,000
4
Beds
2
Baths
1,512
Sq Ft
$228/Sq Ft
Est. Value
About This Home
This home is located at 2539 N Walnut Rd, Las Vegas, NV 89115 and is currently estimated at $344,167, approximately $227 per square foot. 2539 N Walnut Rd is a home located in Clark County with nearby schools including Myrtle Tate Elementary School, Von Tobel Middle School, and Sunrise Mountain High School.
Ownership History
Date
Name
Owned For
Owner Type
Purchase Details
Closed on
Aug 4, 2010
Sold by
Federal Home Loan Mortgage Corporation
Bought by
Jimenez Maria and Cano Jose Bermudez
Current Estimated Value
Home Financials for this Owner
Home Financials are based on the most recent Mortgage that was taken out on this home.
Original Mortgage
$30,000
Outstanding Balance
$19,813
Interest Rate
4.52%
Mortgage Type
Purchase Money Mortgage
Estimated Equity
$324,354
Purchase Details
Closed on
Apr 1, 2010
Sold by
Anderson Eldon and Anderson Debra
Bought by
Federal Home Loan Mortgage Corporation
Purchase Details
Closed on
Nov 5, 2001
Sold by
Anderson Kapua K
Bought by
Anderson Eldon
Purchase Details
Closed on
Jun 27, 2000
Sold by
Anderson Jaime Nicole
Bought by
Kapua K Anderson Revocable Living Trust and Estate Of Kapua K Anderson
Create a Home Valuation Report for This Property
The Home Valuation Report is an in-depth analysis detailing your home's value as well as a comparison with similar homes in the area
Home Values in the Area
Average Home Value in this Area
Purchase History
| Date | Buyer | Sale Price | Title Company |
|---|---|---|---|
| Jimenez Maria | $50,000 | Fidelity National Default S | |
| Federal Home Loan Mortgage Corporation | $57,700 | Accommodation | |
| Anderson Eldon | -- | -- | |
| Kapua K Anderson Revocable Living Trust | -- | -- |
Source: Public Records
Mortgage History
| Date | Status | Borrower | Loan Amount |
|---|---|---|---|
| Open | Jimenez Maria | $30,000 |
Source: Public Records
Tax History Compared to Growth
Tax History
| Year | Tax Paid | Tax Assessment Tax Assessment Total Assessment is a certain percentage of the fair market value that is determined by local assessors to be the total taxable value of land and additions on the property. | Land | Improvement |
|---|---|---|---|---|
| 2025 | $1,241 | $51,754 | $26,950 | $24,804 |
| 2024 | $793 | $51,754 | $26,950 | $24,804 |
| 2023 | $793 | $51,218 | $26,600 | $24,618 |
| 2022 | $1,015 | $45,399 | $22,400 | $22,999 |
| 2021 | $680 | $42,312 | $19,950 | $22,362 |
| 2020 | $629 | $41,573 | $18,900 | $22,673 |
| 2019 | $589 | $37,115 | $14,350 | $22,765 |
| 2018 | $562 | $36,181 | $14,000 | $22,181 |
| 2017 | $977 | $33,303 | $10,500 | $22,803 |
| 2016 | $528 | $30,006 | $6,300 | $23,706 |
| 2015 | $526 | $22,823 | $5,950 | $16,873 |
| 2014 | $583 | $19,124 | $4,200 | $14,924 |
Source: Public Records
Map
Nearby Homes
- 2564 San Marcos St
- 2494 San Marcos St
- 2438 Pine Creek Rd
- 2549 San Marcos St
- 3749 Ponderosa St
- 2504 Sandy Ln
- 2671 San Marcos St
- 2741 San Domingo Ln
- 4090 E Carey Ave
- 3644 San Pascual Ave
- 2551 Boulder Point Ct
- 3843 San Francisco Ave
- 2780 Lincoln Rd
- 3640 Judson Ave
- 2941 Country Manor Ln Unit 27
- 3708 Reseda Cir
- 3844 Fitzpatrick Dr
- 2212 Langmore St
- 2732 Vita Dr
- 4325 Harristown Dr
- 2549 N Walnut Rd
- 2529 N Walnut Rd
- 2540 Oak Glen Way
- 2559 N Walnut Rd
- 2519 N Walnut Rd
- 2550 Oak Glen Way
- 2530 Oak Glen Way
- 2560 Oak Glen Way
- 2520 Oak Glen Way
- 2569 N Walnut Rd
- 2509 N Walnut Rd
- 2538 N Walnut Rd
- 2570 Oak Glen Way
- 2510 Oak Glen Way
- 2579 N Walnut Rd
- 2499 N Walnut Rd
- 2580 Oak Glen Way
- 2541 Oak Glen Way
- 2500 Oak Glen Way
- 2551 Oak Glen Way