254 Charles Ave Unit 1 Staten Island, NY 10302
Port Richmond NeighborhoodEstimated Value: $561,000 - $643,000
2
Beds
1
Bath
1,100
Sq Ft
$542/Sq Ft
Est. Value
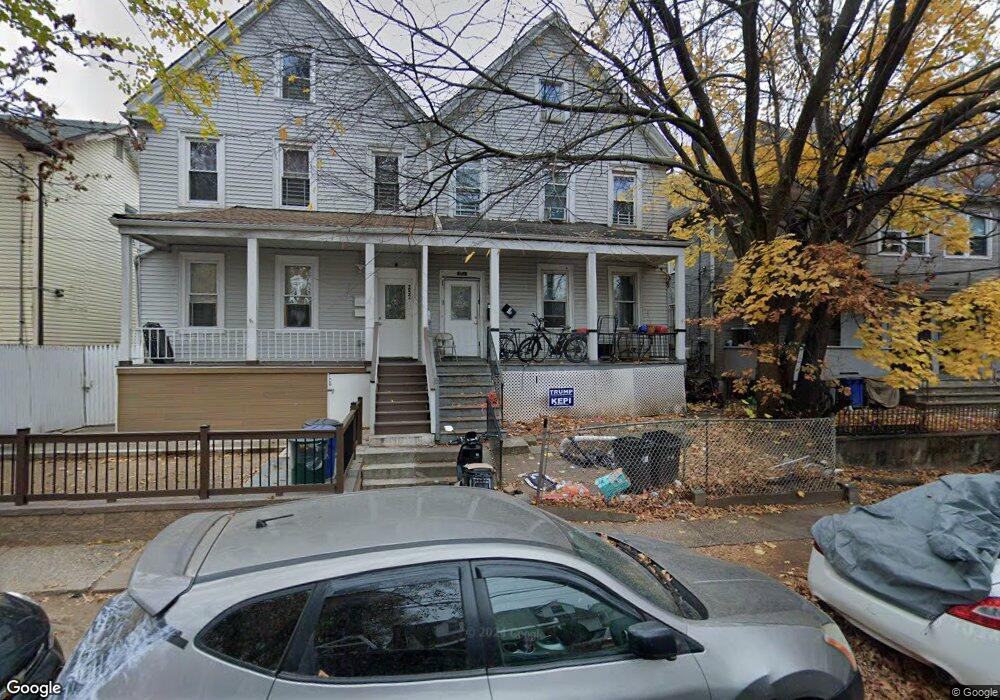
About This Home
This home is located at 254 Charles Ave Unit 1, Staten Island, NY 10302 and is currently estimated at $596,233, approximately $542 per square foot. 254 Charles Ave Unit 1 is a home located in Richmond County with nearby schools including PS 21 Margaret Emery-Elm Park, I.S. 51 Edwin Markham, and Port Richmond High School.
Ownership History
Date
Name
Owned For
Owner Type
Purchase Details
Closed on
Aug 10, 2020
Sold by
254 Charles Staten Llc
Bought by
Kenchen Rahreese
Current Estimated Value
Purchase Details
Closed on
Dec 20, 2019
Sold by
Smalls Lela
Bought by
254 Charles Staten Llc
Purchase Details
Closed on
Apr 5, 2001
Sold by
Windsor Development Corp
Bought by
Capra Philip M
Home Financials for this Owner
Home Financials are based on the most recent Mortgage that was taken out on this home.
Original Mortgage
$236,250
Interest Rate
6.88%
Mortgage Type
FHA
Purchase Details
Closed on
Dec 7, 2000
Sold by
Pmc Realty Corp
Bought by
Windsor Development Corp
Create a Home Valuation Report for This Property
The Home Valuation Report is an in-depth analysis detailing your home's value as well as a comparison with similar homes in the area
Home Values in the Area
Average Home Value in this Area
Purchase History
| Date | Buyer | Sale Price | Title Company |
|---|---|---|---|
| Kenchen Rahreese | -- | None Listed On Document | |
| 254 Charles Staten Llc | $265,000 | Beta Abstract Llc | |
| Capra Philip M | $24,000 | -- | |
| Smalls Lela | $240,000 | Fidelity National Title Ins | |
| Windsor Development Corp | -- | Fidelity National Title Ins | |
| P M C Realty Corp | $150,000 | Fidelity National Title Ins |
Source: Public Records
Mortgage History
| Date | Status | Borrower | Loan Amount |
|---|---|---|---|
| Previous Owner | Smalls Lela | $236,250 |
Source: Public Records
Tax History Compared to Growth
Tax History
| Year | Tax Paid | Tax Assessment Tax Assessment Total Assessment is a certain percentage of the fair market value that is determined by local assessors to be the total taxable value of land and additions on the property. | Land | Improvement |
|---|---|---|---|---|
| 2025 | $3,718 | $36,120 | $2,804 | $33,316 |
| 2024 | $3,718 | $32,160 | $3,039 | $29,121 |
| 2023 | $3,759 | $18,511 | $2,914 | $15,597 |
| 2022 | $3,536 | $33,840 | $5,280 | $28,560 |
| 2021 | $3,566 | $34,500 | $5,280 | $29,220 |
| 2020 | $3,382 | $29,760 | $5,280 | $24,480 |
| 2019 | $3,227 | $27,420 | $5,280 | $22,140 |
| 2018 | $3,145 | $15,426 | $3,659 | $11,767 |
| 2017 | $3,009 | $14,762 | $4,758 | $10,004 |
| 2016 | $2,822 | $14,119 | $4,688 | $9,431 |
| 2015 | $2,467 | $13,320 | $4,380 | $8,940 |
| 2014 | $2,467 | $12,855 | $3,709 | $9,146 |
Source: Public Records
Map
Nearby Homes
- 209 Nicholas Ave
- 231 Charles Ave
- 98 Saint Josephs Ave
- 145 Clinton Place
- 121 Harrison Ave
- 54 Riverside Dr Unit 1AA
- 1594 Castleton Ave
- 152 Port Richmond Ave
- 13 Laforge Ave
- 38 Laforge Ave
- 11 Laforge Ave
- 469 Port Richmond Ave
- 145 Morningside Ave Unit 2C
- 28 Clinton Place
- 28 Hooker Place
- 70 Grove Ave
- 111 Faber St
- 28 Morningstar Rd
- 95 Maple Ave
- 160 Port Richmond Ave
- 254 Charles Ave
- 254 Charles Ave Unit 2
- 252 Charles Ave
- 256 Charles Ave Unit 258
- 256-258 Charles Ave
- 16 Crittenden Place
- 20 Crittenden Place
- 203 Nicholas Ave
- 240 Charles Ave
- 201 Nicholas Ave
- 205 Nicholas Ave
- 217 Nicholas Ave
- 207 Nicholas Ave
- 22 Crittenden Place
- 26 Crittenden Place
- 238 Charles Ave
- 259 Charles Ave
- 181 Hatfield Place
- 185 Hatfield Place
- 195 Nicholas Ave