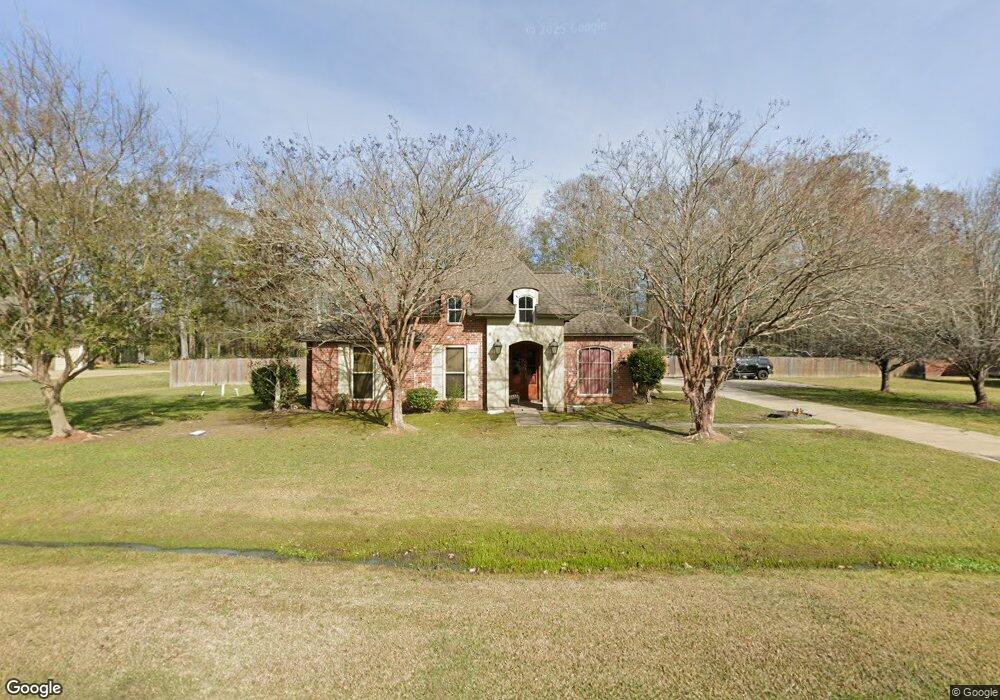
254 Highland Meadows Jackson, LA 70748
Estimated Value: $357,000 - $434,000
4
Beds
3
Baths
2,050
Sq Ft
$194/Sq Ft
Est. Value
About This Home
This home is located at 254 Highland Meadows, Jackson, LA 70748 and is currently estimated at $397,050, approximately $193 per square foot. 254 Highland Meadows is a home located in East Feliciana Parish with nearby schools including East Feliciana High School.
Ownership History
Date
Name
Owned For
Owner Type
Purchase Details
Closed on
Mar 31, 2010
Sold by
Signater Patrick Donnell and Signater Rachel Ann Winters
Bought by
Carter Yvonne
Current Estimated Value
Home Financials for this Owner
Home Financials are based on the most recent Mortgage that was taken out on this home.
Original Mortgage
$250,000
Outstanding Balance
$163,240
Interest Rate
5%
Mortgage Type
Future Advance Clause Open End Mortgage
Estimated Equity
$233,810
Purchase Details
Closed on
Aug 11, 2006
Sold by
Wheeler Construction Inc
Bought by
Signater Patrick and Signater Rachelann
Home Financials for this Owner
Home Financials are based on the most recent Mortgage that was taken out on this home.
Original Mortgage
$183,920
Interest Rate
6.78%
Mortgage Type
New Conventional
Purchase Details
Closed on
Mar 6, 2006
Sold by
Feliciana Development Co Llc
Bought by
Wheeler Construction Inc
Create a Home Valuation Report for This Property
The Home Valuation Report is an in-depth analysis detailing your home's value as well as a comparison with similar homes in the area
Purchase History
We collect this data history from publicly available records. To have your information removed, we recommend requesting removal directly through your county’s website.
| Date | Buyer | Sale Price | Title Company |
|---|---|---|---|
| Carter Yvonne | $245,000 | -- | |
| Signater Patrick | $229,900 | -- | |
| Wheeler Construction Inc | $32,000 | -- |
Source: Public Records
Mortgage History
We collect this data history from publicly available records. To have your information removed, we recommend requesting removal directly through your county’s website.
| Date | Status | Borrower | Loan Amount |
|---|---|---|---|
| Open | Carter Yvonne | $250,000 | |
| Previous Owner | Signater Patrick | $183,920 |
Source: Public Records
Tax History
| Year | Tax Paid | Tax Assessment Tax Assessment Total Assessment is a certain percentage of the fair market value that is determined by local assessors to be the total taxable value of land and additions on the property. | Land | Improvement |
|---|---|---|---|---|
| 2025 | $1,160 | $23,410 | $2,800 | $20,610 |
| 2024 | $1,160 | $23,410 | $2,800 | $20,610 |
| 2023 | $1,160 | $23,410 | $2,800 | $20,610 |
| 2022 | $1,160 | $23,410 | $2,800 | $20,610 |
| 2021 | $1,160 | $23,410 | $2,800 | $20,610 |
| 2020 | $1,155 | $23,410 | $2,800 | $20,610 |
| 2019 | $1,160 | $23,410 | $2,800 | $20,610 |
| 2018 | $1,160 | $23,410 | $2,800 | $20,610 |
| 2017 | $1,160 | $20,610 | $0 | $20,610 |
| 2015 | $1,154 | $23,280 | $2,670 | $20,610 |
| 2014 | $1,154 | $23,280 | $2,670 | $20,610 |
| 2013 | $1,157 | $23,280 | $2,670 | $20,610 |
Source: Public Records
Map
Nearby Homes
- LOT 1 Highland Meadows Dr
- 4011 Balmoral Dr
- 23710 Portwood Ln
- 25247 Shane Ct
- 22658 Sutter Ln
- Lot 47 Treakle Dr
- 1272 Colonial Dr
- 1273 Hermitage Dr
- 23432 Sunnyside Ln
- 23413 Treakle Ln
- 22460 Sutter Ln
- 23316 Elberta Ln
- 23123 Sunnyside Ln
- Lot 50 Treakle Dr
- 22920 Elberta Ln
- 347 E Plains Port Hudson Rd
- 1595 La Hwy 61
- 22871 Brittney Renee Dr
- Lot 9 Ruth Ave
- Lot 19 Duncan Ave
- 14 Highland Meadows Dr
- 23 Highland Meadows Dr
- 22 Highland Meadows Dr
- 21 Highland Meadows Dr
- 19 Highland Meadows Dr
- 18 Highland Meadows Dr
- 274 Highland Meadows Dr
- 234 Highland Meadows Dr
- 274 Highland Meadows
- 602 Highland Meadows Dr
- 26343 E Highland Meadows Dr
- Tract 1 Highland Meadows
- 251 Highland Meadows Dr
- 214 Highland Meadows
- 294 Highland Meadows Dr
- 213 Highland Meadows Dr
- 26314 E Meadow Dr
- 301 Highland Meadows Dr
- 211 Highland Meadows
- 194 Highland Meadows
Your Personal Tour Guide
Ask me questions while you tour the home.