Estimated Value: $226,000 - $260,000
3
Beds
1
Bath
1,314
Sq Ft
$183/Sq Ft
Est. Value
About This Home
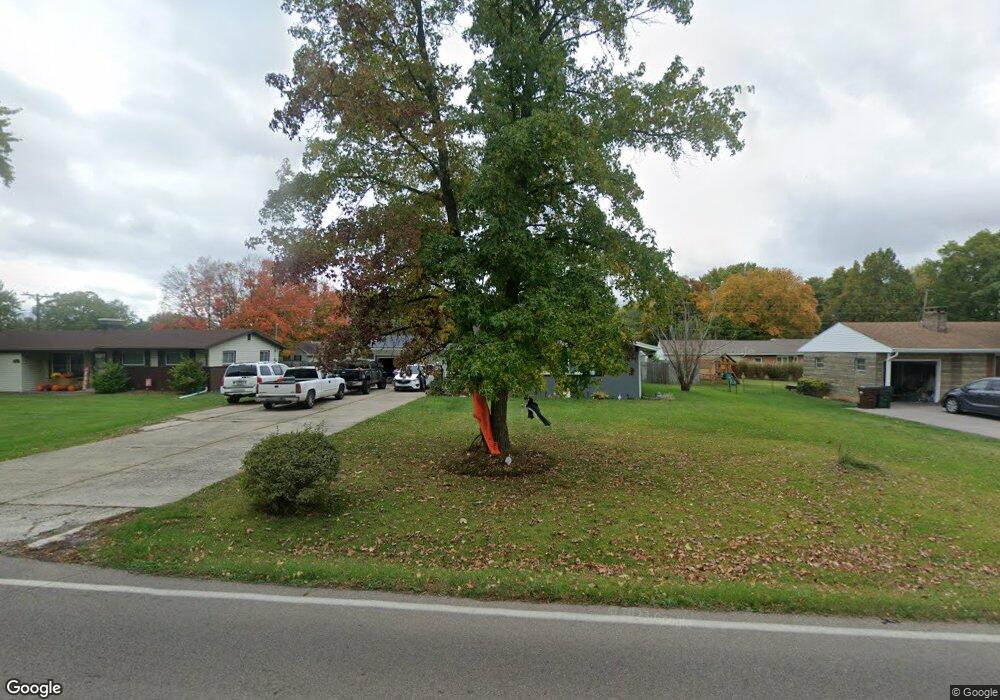
This home is located at 254 Kinsey Rd, Xenia, OH 45385 and is currently estimated at $240,884, approximately $183 per square foot. 254 Kinsey Rd is a home located in Greene County with nearby schools including Xenia High School, Summit Academy Community School for Alternative Learners - Xenia, and Legacy Christian Academy.
Ownership History
Date
Name
Owned For
Owner Type
Purchase Details
Closed on
Aug 27, 2013
Sold by
Miner Paul W
Bought by
Miner Paul W and Louderback Cheryl D
Current Estimated Value
Purchase Details
Closed on
Jun 27, 2013
Sold by
Secretary Of Hud
Bought by
Miner Paul W
Purchase Details
Closed on
Mar 27, 2013
Sold by
Jpmorgan Chase Bank Na
Bought by
Secretary Of Hud
Purchase Details
Closed on
Jan 24, 2013
Sold by
Mcneil J Shannon and Mcneil Lila A
Bought by
Chase Home Finance Llc
Purchase Details
Closed on
Aug 25, 1998
Sold by
Mcglaun Dennis R and Mc Glaun Patricia A
Bought by
Mcneil J Shannon
Home Financials for this Owner
Home Financials are based on the most recent Mortgage that was taken out on this home.
Original Mortgage
$104,900
Interest Rate
7.06%
Mortgage Type
FHA
Create a Home Valuation Report for This Property
The Home Valuation Report is an in-depth analysis detailing your home's value as well as a comparison with similar homes in the area
Home Values in the Area
Average Home Value in this Area
Purchase History
| Date | Buyer | Sale Price | Title Company |
|---|---|---|---|
| Miner Paul W | -- | None Available | |
| Miner Paul W | $58,250 | None Available | |
| Secretary Of Hud | -- | None Available | |
| Chase Home Finance Llc | $72,000 | None Available | |
| Mcneil J Shannon | $105,000 | -- |
Source: Public Records
Mortgage History
| Date | Status | Borrower | Loan Amount |
|---|---|---|---|
| Previous Owner | Mcneil J Shannon | $104,900 |
Source: Public Records
Tax History Compared to Growth
Tax History
| Year | Tax Paid | Tax Assessment Tax Assessment Total Assessment is a certain percentage of the fair market value that is determined by local assessors to be the total taxable value of land and additions on the property. | Land | Improvement |
|---|---|---|---|---|
| 2024 | $3,209 | $62,880 | $12,060 | $50,820 |
| 2023 | $3,056 | $62,880 | $12,060 | $50,820 |
| 2022 | $2,523 | $47,050 | $10,050 | $37,000 |
| 2021 | $2,555 | $47,050 | $10,050 | $37,000 |
| 2020 | $2,456 | $47,050 | $10,050 | $37,000 |
| 2019 | $2,274 | $40,900 | $9,010 | $31,890 |
| 2018 | $2,282 | $40,900 | $9,010 | $31,890 |
| 2017 | $188 | $40,900 | $9,010 | $31,890 |
| 2016 | $2,179 | $38,400 | $9,010 | $29,390 |
| 2015 | $6,264 | $38,400 | $9,010 | $29,390 |
| 2014 | $2,685 | $38,400 | $9,010 | $29,390 |
Source: Public Records
Map
Nearby Homes
- 965 Oak Dale Dr
- 460 Kinsey Rd
- 15 Sexton Dr
- 1359 Eagles Way
- 983 Echo Ct
- 1311 Eagles Way
- 2018 Tahoe Dr
- 2537 Ridge Rd
- 2094 Malibu Trail
- 1764 Highlander Dr
- 1171 N Detroit St
- 1968 El Camino Dr
- 1038 Frederick Dr
- 1872 Harris Ln
- 1815 Promenade Ln
- 493 Hollywood Blvd
- 499 Hollywood Blvd
- 656 Eden Roc Dr
- 1791 Palmer Ct
- 902 N Detroit St
- 264 Kinsey Rd
- 248 Kinsey Rd
- 253 Hardacre Dr
- 245 Hardacre Dr
- 263 Hardacre Dr
- 270 Kinsey Rd
- 1030 Whitestone Rd
- 265 Winding Trail
- 236 Kinsey Rd
- 280 Kinsey Rd
- 1020 Whitestone Rd
- 235 Hardacre Dr
- 1072 Hillcrest Dr
- 237 Kinsey Rd
- 250 Winding Trail
- 252 Hardacre Dr
- 1044 Whitestone Rd
- 228 Kinsey Rd
- 1010 Whitestone Rd
- 271 Winding Trail