Estimated Value: $174,483 - $194,000
3
Beds
1
Bath
1,194
Sq Ft
$153/Sq Ft
Est. Value
About This Home
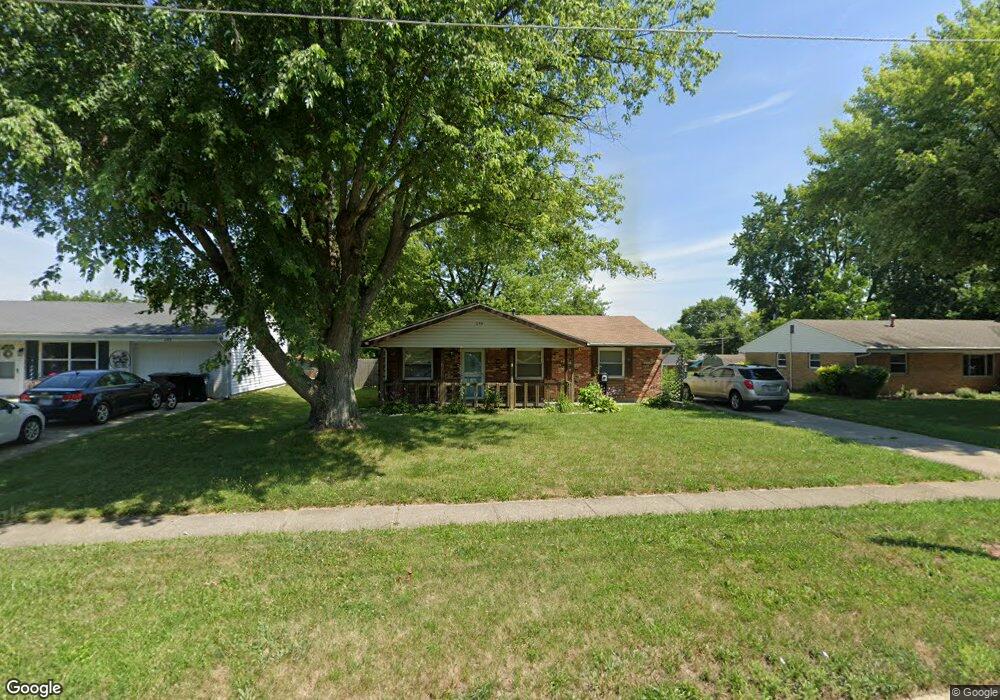
This home is located at 254 Ledbetter Rd, Xenia, OH 45385 and is currently estimated at $182,871, approximately $153 per square foot. 254 Ledbetter Rd is a home located in Greene County with nearby schools including Xenia High School, Summit Academy Community School for Alternative Learners - Xenia, and Legacy Christian Academy.
Ownership History
Date
Name
Owned For
Owner Type
Purchase Details
Closed on
Mar 2, 2022
Sold by
Arrington Shawn
Bought by
Samuels Deangelo D
Current Estimated Value
Home Financials for this Owner
Home Financials are based on the most recent Mortgage that was taken out on this home.
Original Mortgage
$147,283
Outstanding Balance
$137,610
Interest Rate
3.92%
Mortgage Type
FHA
Estimated Equity
$45,261
Purchase Details
Closed on
Sep 16, 2020
Sold by
Vantress Kathy and Ford Harold L
Bought by
Arrington Shawn
Home Financials for this Owner
Home Financials are based on the most recent Mortgage that was taken out on this home.
Original Mortgage
$80,750
Interest Rate
2.9%
Mortgage Type
New Conventional
Purchase Details
Closed on
Apr 25, 2011
Sold by
Ford Rita K
Bought by
Ford Harold L
Create a Home Valuation Report for This Property
The Home Valuation Report is an in-depth analysis detailing your home's value as well as a comparison with similar homes in the area
Home Values in the Area
Average Home Value in this Area
Purchase History
| Date | Buyer | Sale Price | Title Company |
|---|---|---|---|
| Samuels Deangelo D | -- | None Listed On Document | |
| Arrington Shawn | $85,000 | None Available | |
| Ford Harold L | -- | Attorney |
Source: Public Records
Mortgage History
| Date | Status | Borrower | Loan Amount |
|---|---|---|---|
| Open | Samuels Deangelo D | $147,283 | |
| Previous Owner | Arrington Shawn | $80,750 |
Source: Public Records
Tax History Compared to Growth
Tax History
| Year | Tax Paid | Tax Assessment Tax Assessment Total Assessment is a certain percentage of the fair market value that is determined by local assessors to be the total taxable value of land and additions on the property. | Land | Improvement |
|---|---|---|---|---|
| 2024 | $1,626 | $38,000 | $9,060 | $28,940 |
| 2023 | $1,626 | $38,000 | $9,060 | $28,940 |
| 2022 | $1,394 | $27,790 | $6,470 | $21,320 |
| 2021 | $1,413 | $33,050 | $6,470 | $26,580 |
| 2020 | $1,153 | $33,050 | $6,470 | $26,580 |
| 2019 | $851 | $25,640 | $4,160 | $21,480 |
| 2018 | $855 | $25,640 | $4,160 | $21,480 |
| 2017 | $829 | $25,640 | $4,160 | $21,480 |
| 2016 | $727 | $22,850 | $4,160 | $18,690 |
| 2015 | $729 | $22,850 | $4,160 | $18,690 |
| 2014 | $697 | $22,850 | $4,160 | $18,690 |
Source: Public Records
Map
Nearby Homes
- 104 Ledbetter Rd
- 733 State Route 380
- 523 Newport Rd
- 55 Lake St
- 46 Lake St
- 847 S Detroit St
- 260 Pocahontas St
- 633 Xenia Ave
- 979 Mcdowell St
- 453 Walnut St
- 293 S Miami Ave
- 148 Home Ave
- 305-325 Bellbrook Ave
- 400 S Detroit St
- 1208 Bellbrook Ave
- 1272 Bellbrook Ave
- 222 Washington St
- 36 Leaman St
- 98 W 3rd St
- 75 W 2nd St
- 240 Ledbetter Rd
- 268 Ledbetter Rd
- 263 Bedford Ave
- 282 Ledbetter Rd
- 281 Bedford Ave
- 226 Ledbetter Rd
- 249 Bedford Ave
- 293 Bedford Ave
- 231 Bedford Ave
- 277 Ledbetter Rd
- 294 Ledbetter Rd
- 208 Ledbetter Rd
- 213 Bedford Ave
- 307 Bedford Ave
- 295 Ledbetter Rd
- 310 Ledbetter Rd
- 268 Bedford Ave
- 256 Bedford Ave
- 286 Bedford Ave
- 244 Bedford Ave