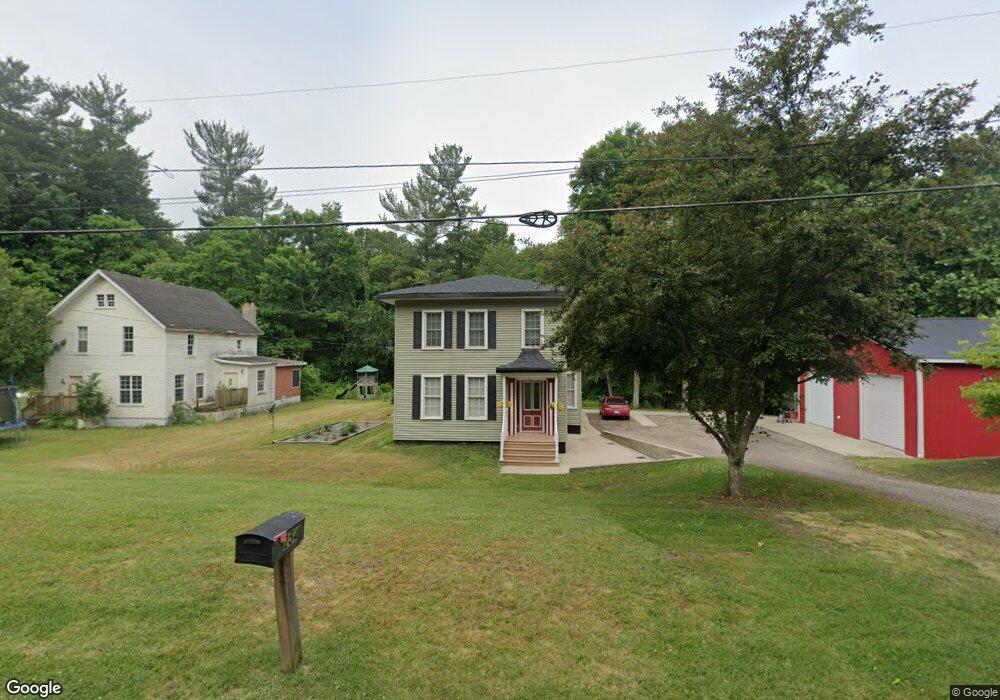
254 Linn St Allegan, MI 49010
Estimated Value: $285,818 - $316,000
3
Beds
3
Baths
2,410
Sq Ft
$126/Sq Ft
Est. Value
About This Home
This home is located at 254 Linn St, Allegan, MI 49010 and is currently estimated at $302,955, approximately $125 per square foot. 254 Linn St is a home located in Allegan County with nearby schools including West Ward Elementary School, L.E. White Middle School, and Allegan High School.
Ownership History
Date
Name
Owned For
Owner Type
Purchase Details
Closed on
Feb 1, 2010
Sold by
Everhome Mortgage Company
Bought by
Federal National Mortgage Association
Current Estimated Value
Purchase Details
Closed on
Jan 7, 2010
Sold by
Sanderson Jeremy and Sanderson Anne
Bought by
Everhome Mortgage Company
Purchase Details
Closed on
Oct 13, 2004
Sold by
Graham Robert C and Graham Martha
Bought by
Sanderson Jeremy and Sanderson Anne
Home Financials for this Owner
Home Financials are based on the most recent Mortgage that was taken out on this home.
Original Mortgage
$99,000
Interest Rate
5.89%
Mortgage Type
Purchase Money Mortgage
Create a Home Valuation Report for This Property
The Home Valuation Report is an in-depth analysis detailing your home's value as well as a comparison with similar homes in the area
Home Values in the Area
Average Home Value in this Area
Purchase History
| Date | Buyer | Sale Price | Title Company |
|---|---|---|---|
| Federal National Mortgage Association | -- | None Available | |
| Everhome Mortgage Company | $82,814 | None Available | |
| Sanderson Jeremy | $99,000 | Chicago Title |
Source: Public Records
Mortgage History
| Date | Status | Borrower | Loan Amount |
|---|---|---|---|
| Previous Owner | Sanderson Jeremy | $99,000 |
Source: Public Records
Tax History Compared to Growth
Tax History
| Year | Tax Paid | Tax Assessment Tax Assessment Total Assessment is a certain percentage of the fair market value that is determined by local assessors to be the total taxable value of land and additions on the property. | Land | Improvement |
|---|---|---|---|---|
| 2025 | $1,100 | $153,400 | $16,800 | $136,600 |
| 2024 | $1,001 | $134,200 | $16,100 | $118,100 |
| 2023 | $1,038 | $104,900 | $14,900 | $90,000 |
| 2022 | $1,001 | $90,200 | $11,800 | $78,400 |
| 2021 | $957 | $87,400 | $10,400 | $77,000 |
| 2020 | $944 | $63,300 | $9,300 | $54,000 |
| 2019 | $920 | $39,700 | $11,500 | $28,200 |
| 2018 | $884 | $28,100 | $11,500 | $16,600 |
| 2017 | $0 | $26,800 | $11,500 | $15,300 |
| 2016 | $0 | $19,700 | $9,200 | $10,500 |
| 2015 | -- | $19,700 | $9,200 | $10,500 |
| 2014 | -- | $21,700 | $9,200 | $12,500 |
| 2013 | $1,337 | $24,600 | $9,200 | $15,400 |
Source: Public Records
Map
Nearby Homes