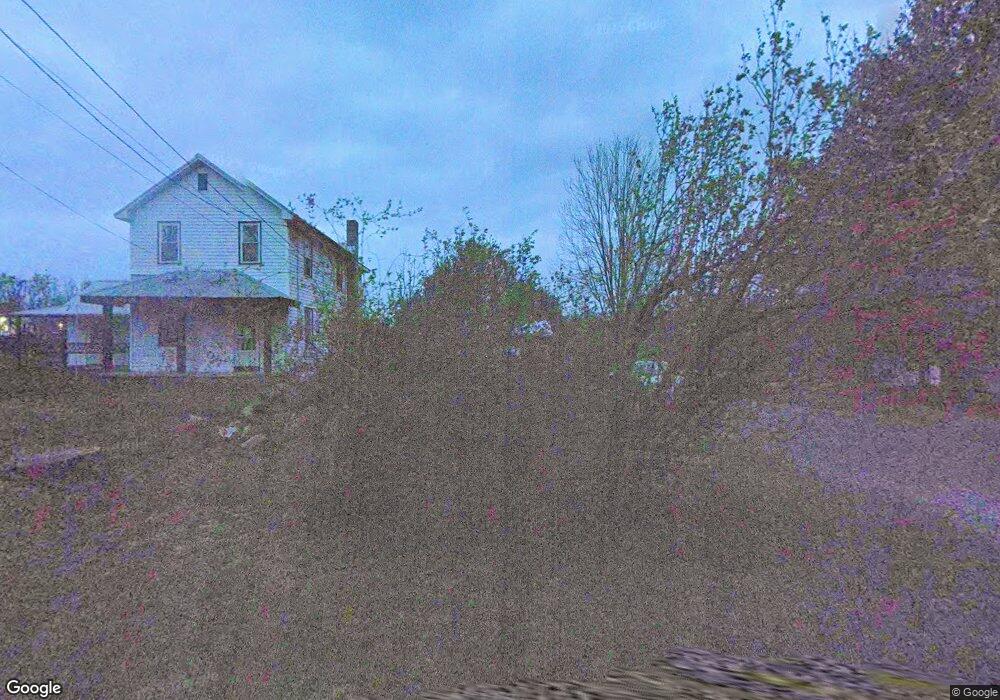
254 Maple Hollow Rd Duncansville, PA 16635
Estimated Value: $150,000 - $217,000
2
Beds
1
Bath
1,172
Sq Ft
$154/Sq Ft
Est. Value
About This Home
This home is located at 254 Maple Hollow Rd, Duncansville, PA 16635 and is currently estimated at $179,965, approximately $153 per square foot. 254 Maple Hollow Rd is a home located in Blair County with nearby schools including Foot of Ten Elementary School, Hollidaysburg Area Junior High School, and Hollidaysburg Area Senior High School.
Ownership History
Date
Name
Owned For
Owner Type
Purchase Details
Closed on
Jan 3, 2023
Sold by
Baker Stephen
Bought by
Cooper John
Current Estimated Value
Home Financials for this Owner
Home Financials are based on the most recent Mortgage that was taken out on this home.
Original Mortgage
$30,000
Outstanding Balance
$15,227
Interest Rate
6.58%
Mortgage Type
Seller Take Back
Estimated Equity
$164,738
Purchase Details
Closed on
Mar 31, 2021
Sold by
Baker Delores and Harpster Brenda
Bought by
Baker Stephen
Purchase Details
Closed on
Mar 18, 2021
Sold by
Harpster Brenda and Last Will & Testament Of Dolor
Bought by
Baker Stephen
Purchase Details
Closed on
Mar 29, 2010
Sold by
Deutsche Bank National Trust Company
Bought by
Baker Joseph L and Baker Dolores A
Purchase Details
Closed on
Mar 5, 2010
Sold by
Keagy Shaun C and Keagy Michelle R
Bought by
Deutsche Bank National Trust Company
Create a Home Valuation Report for This Property
The Home Valuation Report is an in-depth analysis detailing your home's value as well as a comparison with similar homes in the area
Home Values in the Area
Average Home Value in this Area
Purchase History
| Date | Buyer | Sale Price | Title Company |
|---|---|---|---|
| Cooper John | $12,000 | Universal Settlement Services | |
| Cooper John | $6,000 | Universal Settlement Services | |
| Cooper John | $12,000 | Universal Settlement Services | |
| Baker Stephen | -- | Gieg Realty Services | |
| Baker Stephen | -- | None Available | |
| Baker Joseph L | $39,900 | None Available | |
| Deutsche Bank National Trust Company | $7,367 | None Available |
Source: Public Records
Mortgage History
| Date | Status | Borrower | Loan Amount |
|---|---|---|---|
| Open | Cooper John | $30,000 |
Source: Public Records
Tax History Compared to Growth
Tax History
| Year | Tax Paid | Tax Assessment Tax Assessment Total Assessment is a certain percentage of the fair market value that is determined by local assessors to be the total taxable value of land and additions on the property. | Land | Improvement |
|---|---|---|---|---|
| 2025 | $1,989 | $128,100 | $32,000 | $96,100 |
| 2024 | $1,943 | $128,100 | $32,000 | $96,100 |
| 2023 | $2,182 | $0 | $0 | $0 |
| 2022 | $2,164 | $153,000 | $56,900 | $96,100 |
| 2021 | $2,113 | $153,000 | $56,900 | $96,100 |
| 2020 | $2,109 | $153,000 | $56,900 | $96,100 |
| 2019 | $2,055 | $153,000 | $56,900 | $96,100 |
| 2018 | $1,934 | $153,000 | $56,900 | $96,100 |
| 2017 | $15,721 | $153,000 | $56,900 | $96,100 |
| 2016 | $193 | $4,800 | $1,110 | $3,690 |
| 2015 | $193 | $4,800 | $1,110 | $3,690 |
| 2014 | $193 | $4,800 | $1,110 | $3,690 |
Source: Public Records
Map
Nearby Homes
- 605 13th St
- 306 Clayton Dr
- 1970 Hixton Rd
- 145 Willowbrook Village
- 00 Kuhn Ln
- 563 Castle Dr
- 309 Beamer Dr
- 1029 6th Ave
- Lot 10 Estate Dr
- 111 Estate Dr
- 116 Estate Dr
- 1016 5th Ave
- 151 Bridge Ln
- 3091 Colonial Dr
- 119 Spencer Creek Dr
- 2042 Old Route 22
- 202 Patch Way Rd
- Lot 20 Patch Way Rd
- 1201 Countryview Dr
- 1012 Gray Ln
- 258 Maple Hollow Rd
- 242 Maple Hollow Rd
- 234 Maple Hollow Rd
- 268 Maple Hollow Rd
- 224 Maple Hollow Rd
- 269 Maple Hollow Rd
- 241 Maple Hollow Rd
- 210 Maple Hollow Rd
- 283 Maple Hollow Rd
- 3 Woodland Terrace
- 213 Maple Hollow Rd
- 11 Tree Ln
- 13 Tree Ln
- 15 Woodland Terrace
- 17 Tree Ln
- 389 Maple Hollow Rd
- 289 Maple Hollow Rd
- 31 Woodland Terrace
- 33 Woodland Terrace
- 37 Woodland Terrace