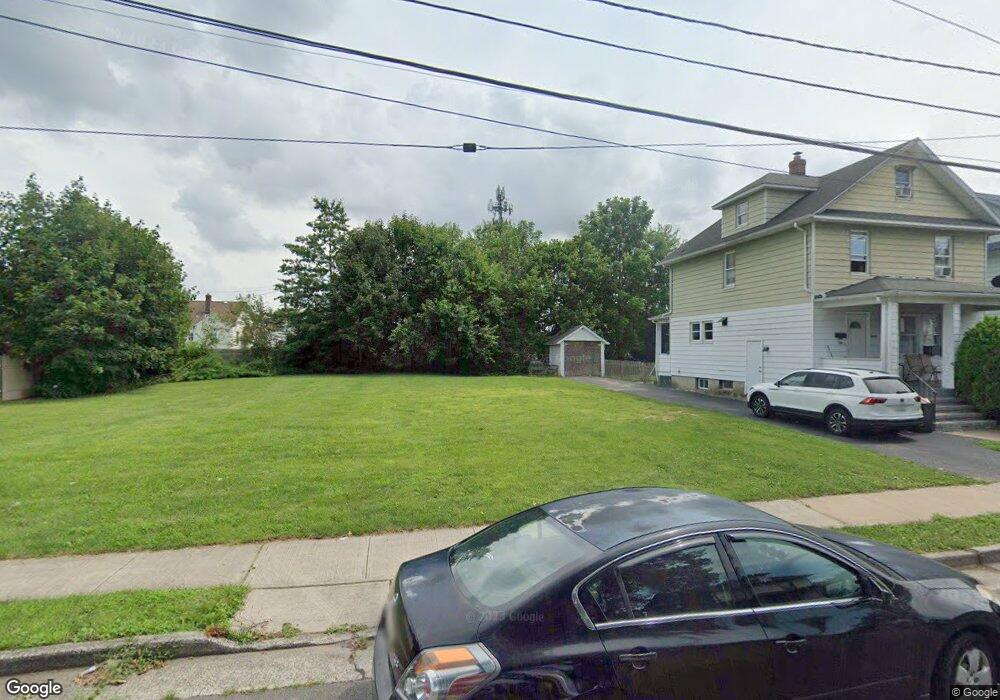
254 N 2nd Ave Manville, NJ 08835
Estimated Value: $394,000
--
Bed
--
Bath
1,422
Sq Ft
$277/Sq Ft
Est. Value
About This Home
This home is located at 254 N 2nd Ave, Manville, NJ 08835 and is currently estimated at $394,000, approximately $277 per square foot. 254 N 2nd Ave is a home located in Somerset County with nearby schools including Weston Elementary School, Roosevelt School, and Alexander Batcho Intermediate School (ABIS).
Ownership History
Date
Name
Owned For
Owner Type
Purchase Details
Closed on
Jun 17, 2015
Sold by
Volker Cheryl A
Bought by
The State Of New Jersey
Current Estimated Value
Purchase Details
Closed on
Nov 26, 1996
Sold by
Maziarczk Michael
Bought by
Volker Cheryl
Home Financials for this Owner
Home Financials are based on the most recent Mortgage that was taken out on this home.
Original Mortgage
$105,000
Interest Rate
7.82%
Purchase Details
Closed on
Oct 26, 1988
Sold by
Maziarczyk Joan
Bought by
Maziarczyk Michael
Create a Home Valuation Report for This Property
The Home Valuation Report is an in-depth analysis detailing your home's value as well as a comparison with similar homes in the area
Home Values in the Area
Average Home Value in this Area
Purchase History
| Date | Buyer | Sale Price | Title Company |
|---|---|---|---|
| The State Of New Jersey | $200,000 | Old Republic Natl Title Ins | |
| Volker Cheryl | $119,000 | -- | |
| Maziarczyk Michael | -- | -- |
Source: Public Records
Mortgage History
| Date | Status | Borrower | Loan Amount |
|---|---|---|---|
| Previous Owner | Volker Cheryl | $105,000 |
Source: Public Records
Tax History Compared to Growth
Tax History
| Year | Tax Paid | Tax Assessment Tax Assessment Total Assessment is a certain percentage of the fair market value that is determined by local assessors to be the total taxable value of land and additions on the property. | Land | Improvement |
|---|---|---|---|---|
| 2025 | -- | $315,800 | $136,800 | $179,000 |
| 2024 | -- | $279,300 | $103,600 | $175,700 |
| 2023 | -- | $265,600 | $94,100 | $171,500 |
| 2022 | -- | $258,100 | $94,100 | $164,000 |
| 2021 | $0 | $240,600 | $94,100 | $146,500 |
| 2020 | $0 | $224,500 | $84,600 | $139,900 |
| 2019 | $0 | $212,800 | $84,600 | $128,200 |
| 2018 | $0 | $222,300 | $94,100 | $128,200 |
| 2017 | $0 | $222,300 | $94,100 | $128,200 |
| 2016 | $4,351 | $222,300 | $94,100 | $128,200 |
| 2015 | $4,351 | $180,000 | $122,600 | $57,400 |
| 2014 | $4,264 | $180,000 | $122,600 | $57,400 |
Source: Public Records
Map
Nearby Homes