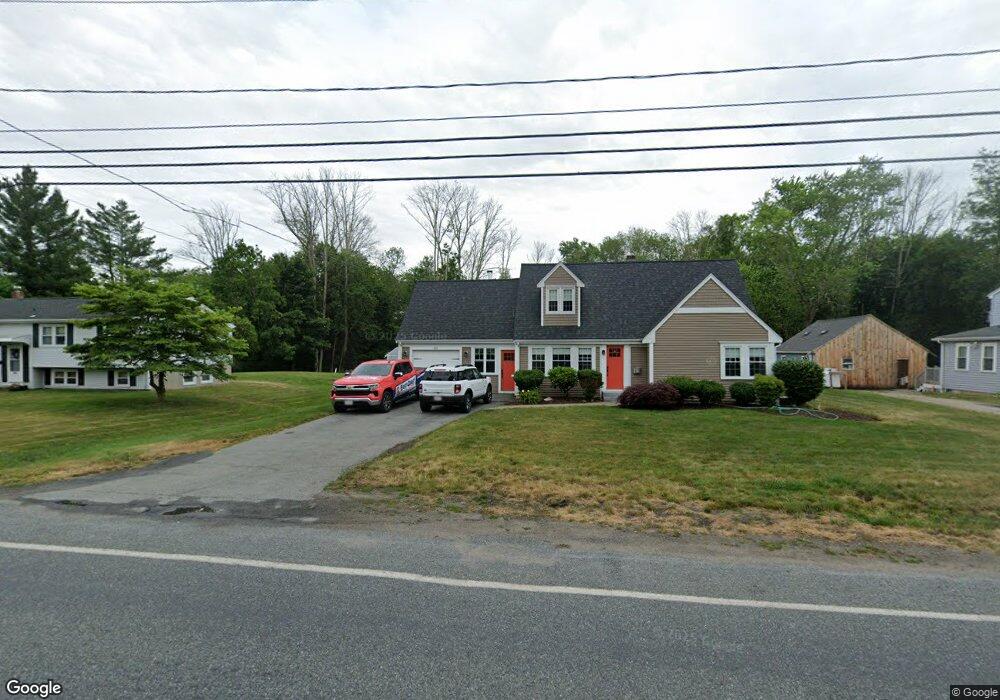
254 N Central St East Bridgewater, MA 02333
Estimated Value: $571,969 - $628,000
3
Beds
2
Baths
1,912
Sq Ft
$314/Sq Ft
Est. Value
About This Home
This home is located at 254 N Central St, East Bridgewater, MA 02333 and is currently estimated at $599,492, approximately $313 per square foot. 254 N Central St is a home located in Plymouth County with nearby schools including Central Elementary School, Gordon W Mitchell Middle School, and East Bridgewater Jr./Sr. High School.
Ownership History
Date
Name
Owned For
Owner Type
Purchase Details
Closed on
Dec 18, 1989
Sold by
Ek Richard N
Bought by
Pilkington Peter H
Current Estimated Value
Home Financials for this Owner
Home Financials are based on the most recent Mortgage that was taken out on this home.
Original Mortgage
$107,000
Interest Rate
9.73%
Mortgage Type
Purchase Money Mortgage
Create a Home Valuation Report for This Property
The Home Valuation Report is an in-depth analysis detailing your home's value as well as a comparison with similar homes in the area
Home Values in the Area
Average Home Value in this Area
Purchase History
| Date | Buyer | Sale Price | Title Company |
|---|---|---|---|
| Pilkington Peter H | $134,900 | -- |
Source: Public Records
Mortgage History
| Date | Status | Borrower | Loan Amount |
|---|---|---|---|
| Open | Pilkington Peter H | $100,000 | |
| Closed | Pilkington Peter H | $105,000 | |
| Closed | Pilkington Peter H | $107,000 |
Source: Public Records
Tax History Compared to Growth
Tax History
| Year | Tax Paid | Tax Assessment Tax Assessment Total Assessment is a certain percentage of the fair market value that is determined by local assessors to be the total taxable value of land and additions on the property. | Land | Improvement |
|---|---|---|---|---|
| 2025 | $6,562 | $480,000 | $174,700 | $305,300 |
| 2024 | $6,447 | $465,800 | $168,000 | $297,800 |
| 2023 | $6,303 | $436,200 | $168,000 | $268,200 |
| 2022 | $5,986 | $383,700 | $152,800 | $230,900 |
| 2021 | $5,831 | $342,000 | $146,800 | $195,200 |
| 2020 | $5,678 | $328,400 | $141,200 | $187,200 |
| 2019 | $5,503 | $313,400 | $134,900 | $178,500 |
| 2018 | $5,322 | $296,300 | $134,900 | $161,400 |
| 2017 | $5,170 | $282,500 | $128,600 | $153,900 |
| 2016 | $5,023 | $276,600 | $128,600 | $148,000 |
| 2015 | $4,836 | $272,300 | $127,800 | $144,500 |
| 2014 | $4,643 | $267,300 | $125,100 | $142,200 |
Source: Public Records
Map
Nearby Homes