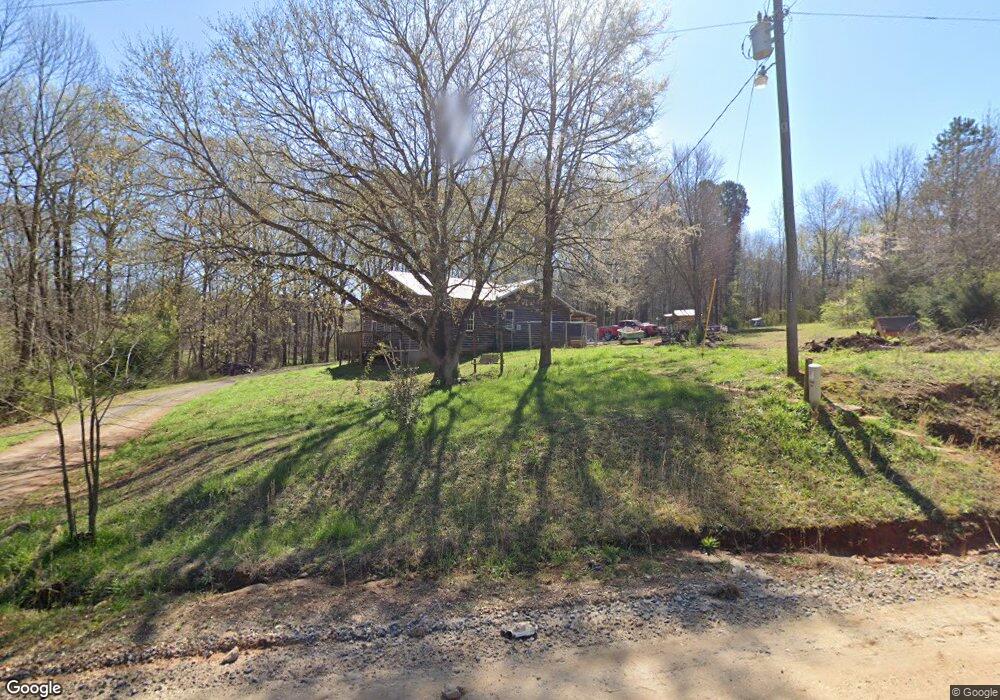
254 Riverbend Rd SE Commerce, GA 30530
Estimated Value: $234,000 - $297,587
3
Beds
2
Baths
1,748
Sq Ft
$150/Sq Ft
Est. Value
About This Home
This home is located at 254 Riverbend Rd SE, Commerce, GA 30530 and is currently estimated at $261,647, approximately $149 per square foot. 254 Riverbend Rd SE is a home with nearby schools including Banks County Primary School, Banks County Elementary School, and Banks County Middle School.
Ownership History
Date
Name
Owned For
Owner Type
Purchase Details
Closed on
Jul 27, 2021
Sold by
Mitchell Jaclyn
Bought by
Mitchell Chris
Current Estimated Value
Purchase Details
Closed on
Mar 5, 2014
Sold by
Mitchell Chris
Bought by
Mitchell Jaclyn
Purchase Details
Closed on
Oct 11, 2012
Sold by
Welborn Aaron
Bought by
Mitchell Chris and Mitchell Jaclyn
Purchase Details
Closed on
Sep 27, 2012
Sold by
Hedrick Christopher Paul
Bought by
Welborn Aaron
Purchase Details
Closed on
Apr 15, 2011
Sold by
Welborn Aaron
Bought by
Hedrick Christopher Paul and Hedrick Laura Ann
Purchase Details
Closed on
Apr 13, 2011
Sold by
Osborne Deborah Ann
Bought by
Welborn Aaron
Purchase Details
Closed on
Nov 22, 2010
Sold by
Welborn Aaron
Bought by
Osborne Deborah Ann
Purchase Details
Closed on
Jul 2, 2010
Sold by
Jones Ronald
Bought by
Welborn Aaron
Purchase Details
Closed on
Mar 26, 2008
Sold by
Wellborn Aaron
Bought by
Jones Ronald and Jones Marie Elizabeth
Purchase Details
Closed on
Feb 21, 2007
Sold by
Greenway William
Bought by
Welborn Aaron
Create a Home Valuation Report for This Property
The Home Valuation Report is an in-depth analysis detailing your home's value as well as a comparison with similar homes in the area
Home Values in the Area
Average Home Value in this Area
Purchase History
| Date | Buyer | Sale Price | Title Company |
|---|---|---|---|
| Mitchell Chris | -- | -- | |
| Mitchell Jaclyn | -- | -- | |
| Mitchell Chris | $60,088 | -- | |
| Welborn Aaron | -- | -- | |
| Hedrick Christopher Paul | $56,000 | -- | |
| Welborn Aaron | -- | -- | |
| Osborne Deborah Ann | $82,196 | -- | |
| Welborn Aaron | -- | -- | |
| Jones Ronald | $89,000 | -- | |
| Welborn Aaron | $14,800 | -- |
Source: Public Records
Tax History Compared to Growth
Tax History
| Year | Tax Paid | Tax Assessment Tax Assessment Total Assessment is a certain percentage of the fair market value that is determined by local assessors to be the total taxable value of land and additions on the property. | Land | Improvement |
|---|---|---|---|---|
| 2025 | $1,505 | $86,166 | $18,492 | $67,674 |
| 2024 | $1,505 | $80,829 | $16,811 | $64,018 |
| 2023 | $845 | $61,517 | $15,163 | $46,354 |
| 2022 | $1,036 | $51,296 | $12,276 | $39,020 |
| 2021 | $988 | $44,203 | $9,443 | $34,760 |
| 2020 | $679 | $29,611 | $6,950 | $22,661 |
| 2019 | $978 | $42,456 | $6,950 | $35,506 |
| 2018 | $924 | $39,456 | $6,390 | $33,066 |
| 2017 | $944 | $38,623 | $5,557 | $33,066 |
| 2016 | $971 | $38,623 | $5,557 | $33,066 |
| 2015 | $965 | $38,622 | $5,557 | $33,066 |
| 2014 | $965 | $40,916 | $7,850 | $33,066 |
| 2013 | -- | $40,915 | $7,850 | $33,065 |
Source: Public Records
Map
Nearby Homes
- 7527 Highway 326
- 1020 Riverbend Rd
- 24 Tomlin Way
- 775 Riverbend Rd
- 0 Carson Rd Unit LOT 32 10594149
- 0 Carson Rd Unit 7640890
- 1065 Hebron Rd
- 163 M t Trail
- 0 5 Points Rd
- 731 Borders Rd
- 139 Meadow Lake Dr
- 161 Meadow Lake Dr
- 1679 Fort Lamar Rd
- 166 Timberlane Dr
- 689 Riverside Ct
- 5591 Jot Em Down Rd
- 0 Freedom Ln Unit 9B
- 0 Freedom Ln Unit 18C 10380663
- 0 Freedom Ln Unit 9D
- 0 Freedom Ln Unit 9C
- 0 Riverbend Rd SE Unit CM970440
- 0 Riverbend Rd SE Unit 10303122
- 0 Riverbend Rd SE Unit 20060080
- 0 Riverbend Rd SE Unit 8983764
- 0 Riverbend Rd SE Unit 6887902
- 0 Riverbend Rd SE Unit 8290805
- 0 Riverbend Rd SE Unit 8293115
- 0 Riverbend Rd SE Unit 8893511
- 0 Riverbend Rd SE Unit 7429898
- 0 Riverbend Rd SE Unit 7551953
- 0 Riverbend Rd SE Unit 8182764
- 0 Riverbend Rd SE Unit 8265755
- 0 Riverbend Rd SE Unit 8629313
- 214 Riverbend Rd SE
- 226 Riverbend Rd SE
- 106 Riverbend Ln
- 213 Riverbend Rd SE
- 213 Riverbend Rd SE
- 3383 Highway 326
- 0 Alexander Rd Unit 8093223